Real Analog: Chapter 11
- Chapter 11 Materials
-
- Lecture Material:
- Lecture 29 PowerPoint Slides: Frequency response examples, frequency response plots & signal spectra, filters
- Lecture 30 PowerPoint Slides: Checking frequency response results, time-to-frequency domain relations for first-order filters, Bode plots
- Chapter 11 Videos:
- Lab 11 Video 1: Introduction to Frequency Response: Using frequency response to estimate a circuit's behavior. A low-pass filter is used as an example to filter noise out of a sinusoidal signal.
- Lab 11 Video 2: Practical Filters: Examples of low-pass filters are presented. The properties of passive vs. active filters are compared, especially relative to the effects of applying a “load” to the filter.
- Lab 11 Video 3: Bode Plots: Bode plots and their creation using the Analog Discovery Network Analyzer.
-
-
- Exercise Solutions: Chapter 11 exercise solutions
- Homework: Chapter 11 homework problems
11. Introduction and Chapter Objectives
In section 10.6, we saw that a system’s frequency response provided a steady-state input-output relationship for a system, as a function of frequency. We could apply this frequency response to the phasor representation of the input signal in order to determine the system’s steady-state sinusoidal response – we simply evaluated the frequency response at the appropriate frequencies to determine the effect of the system on the input sinusoids. This approach had the potential for simplifying our analysis considerably, particularly for the case in which the input signal contained multiple sinusoids with different frequencies.
In Chapter 10, the signals we considered consisted only of individual sinusoids. It is more useful, however, in some ways to think in terms of the inputs and outputs of the system as functions of frequency, in the same way in which we considered the frequency response of the system to be a function of frequency in section 10.6. We can then perform our analysis of the system entirely in terms of the frequencies involved. This leads to the use of the system’s frequency response directly as a design and analysis tool. In many cases, this means that the actual time- domain behavior of the system or signal is of limited interest (or in some cases, not considered at all). Some examples of frequency domain analyses are:
- Determining dominant sinusoidal frequency components in a measured signal. Complex signals can often be represented as a superposition of several sinusoidal components with different frequencies. Identifying sinusoidal components with large amplitudes (the so-called dominant frequencies) can help with many design problems. One application of this is in the area of combustion instability – combustion processes in rocket engines can become unstable due to a variety of reasons, any of which can result in catastrophic failure of the engine. The type of instability which occurs is generally linked to a particular frequency; identification of the frequency of the pressure oscillations associated with the combustion instability is generally the first step in determining the cause of the instability.
- Designing systems to provide a desired frequency response. Audio components in stereo systems are generally designed to produce a desired frequency response. A graphic equalizer, for example, can be used to boost (or amplify) some frequency ranges and attenuate other frequency ranges. When adjusting the settings on an equalizer, you are essentially directly adjusting the system’s frequency response to provide a desired system response.
This chapter begins in section 11.1 with a brief review of frequency responses and an overview of the use of the frequency response in system analysis and design. In section 11.2, we discuss representation of signals in terms of their frequency content. At this time, we will also represent the frequency content of the input and output signals and the frequency response of the system in graphical format – this helps us visualize the frequency content of the signals and system. This leads us to think in terms of using a system to create a signal with a desired frequency content – this process is called filtering and is discussed in section 11.3. Using logarithmic scales to represent the signal and system frequency responses can – in many cases – simplify the analysis or design process; this format of presentation is called a Bode plot, and they are very briefly introduced in section 11.4. We will discuss Bode plots in more depth in later chapters.
It is important to keep in mind that, when we are performing frequency domain analyses, we are restricting our attention to the steady-state sinusoidal response of the system. Frequency domain design and analysis methods are so pervasive that they are often used to infer the system’s transient response and/or its response to non- sinusoidal signals, so it is sometimes possible to forget the origins and limitations of the original concepts!
After Completing this Chapter, You Should be Able to:
- Use the frequency response of a system to determine the frequency domain response of a system to a given input
- State from memory the definition of signal spectrum
- Create plots of given signal spectra
- Plot a circuit’s magnitude and phase responses
- Check a circuit’s amplitude response at low and high frequencies against the expected physical behavior of the circuit
- Graphically represent a system’s frequency domain response from provided signal spectra plots and plots of the system’s frequency response
- Identify low pass and high pass filters
- Calculate a system’s cutoff frequency
- Determine the DC gain of an electrical circuit
- Write, from memory, the equation used to convert gains to decibel form
- Sketch straight-line amplitude approximations to Bode plots
- Sketch straight-line phase approximations to Bode plots
11.1: Introduction to Steady-state Sinusoidal Analysis
In section 10.6, we defined the frequency response $H(j \omega)$ of a system as a complex function of frequency which describes the relationship between the steady state sinusoidal response of a system and the corresponding sinusoidal input. Thus, if a sinusoidal input with some frequency $\omega_0$ is applied to a system with frequency response $H(j \omega)$, the amplitude of the output sinusoid is the input sinusoid’s amplitude multiplied by the magnitude response of the system, evaluated at the frequency $\omega_0$. The phase angle of the output sinusoid is the sum of the input sinusoid’s phase and the phase response of the system, evaluated at the frequency $\omega_0$. The overall idea is presented in block diagram form in Figure 11.1 below.
The true power of the frequency response is, however, if we consider both the system’s input and output phasors to be complex functions of frequency, in the same way that the frequency response is a complex function of frequency. In this case, the block diagram of Figure 11.1 can be represented as shown in Figure 11.2.
In Figure 11.2, the output is determined by multiplying the phasor representation of the input by the system’s frequency response. It is important to keep in mind that the arguments of this multiplication are complex functions of frequency – both the input and the frequency response at any frequency are complex numbers, so the output at any frequency is also a complex number. We typically use polar form to represent these complex numbers, so the amplitude of the output signal is the product of the amplitude of the input signal and the magnitude response of the system and the phase of the output signal is the sum of the phase of the input and the phase response of the system. Mathematically, these are expressed as:
$$|\underline{Y}(j \omega)|=|\underline{U}(j \omega)| \cdot |H (j \omega)| (Eq. 11.1)$$
And
$$\angle \underline{Y}(j \omega) = \angle \underline{U}(j \omega) + \angle H(j \omega) (Eq. 11.2)$$
We now present two examples of the process defined by equations (11.1) and (11.2) above.
Example 11.1
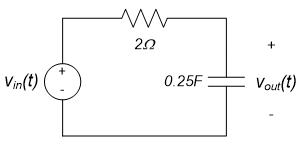
Determine the phasor representation for $v_{out}(t)$ in the circuit shown below as a function of frequency, if the input voltage is $v_{in}(t) = 3 \cos(2t+20^{\circ}) + 7 \cos(4t-60^{\circ})$. (Note: this problem is the same as that of Example 10.19 of chapter 10.6; the difference is primarily philosophical.)
The frequency response of this circuit, for arbitrary resistance and capacitance values, was determined in example 10.18 of chapter 10.6. For our specific resistor and capacitor values, this becomes:
$$H(j \omega) = \frac{1}{1+j \omega RC} = \frac{1}{1+j \omega(2 \Omega)(0.25F)} = \frac{1}{1+j \omega(0.5)} = \frac{2}{2+j \omega}$$
We can represent the input as a piecewise function of frequency:
$$\underline{V}_{in} = \begin{cases} 3 \angle 20^{\circ}, & \omega = 2 \text{rad/sec} \\ 7 \angle -60^{\circ}, & \omega = 4 \text{rad/sec} \\ 0, & \text{otherwise} \end{cases} $$
The input phasor is now considered to be a function of frequency, whose only nonzero components are at frequencies of 2 rad/sec and 4 rad/sec.
The phasor output is simply the product of the input phasor as a function of frequency and the frequency response. For frequencies other than 2 rad/sec and 4 rad/sec, the input is zero and the frequency response is finite, so the output is zero. We determined the output phasor at frequencies of 2 and 4 rad/sec in example 10.19 in section 10.6; using those results allows us to write the output phasor directly as:
$$\underline{V}_{out} = \begin{cases} \frac{3}{\sqrt{2}} \angle -25^{\circ}, & \omega = 2 \text{rad/sec} \\ \frac{7}{\sqrt{5}} \angle -123.4^{\circ}, & \omega = 4 \text{rad/sec} \\ 0, & \text{otherwise} \end{cases} $$
Example 11.2
The frequency response of a system, $H(j \omega)$, and the frequency domain input to the system, $\underline{U}(j \omega)$, are given below. The frequency response is dimensionless, the input has units of volts, and the units of frequency are rad/sec. Determine the system output $\underline{Y}(j \omega)$.
$$\underline{U}_{j \omega} = \begin{cases} j \omega, & 0 < \omega \leq 1 \\ j(2-\omega), & 1< \omega < 2 \\ 0, & \text{otherwise} \end{cases} $$
$$\underline{U}_{j \omega} = \begin{cases} 0, & 0 < \omega \leq 0.5 \\ 1, & 0.5 < \omega \leq 1.5 \\ 0, & \text{otherwise} \end{cases} $$
The system output is determined from a point-by-point multiplication of the input and the frequency response. In this case, both the input to the system and the system frequency response are defined as piecewise functions of frequency, so we must perform a piecewise multiplication to obtain the output. The output, for various ranges of frequency, is obtained below:
$0 < \omega \leq 0.5$:
- In this range, $H(j \omega) =0$ and the input is finite, so $\underline{Y}(j \omega)=0$.
$0.5 < \omega \leq 1.5$:
- In this range, $H(j \omega)=1$ and $\underline{U}(j \omega)= j \omega$, so the output is: $\underline{Y}=(1)(j \omega)=j \omega$
$1< \omega \leq 1.5$:
- In this range, $H(j \omega)=1$ and $\underline{U}(j \omega)=j(2-\omega)$, so the output is: $\underline{Y}=j(2-\omega)$.
$1.5< \omega \leq 2$:
- In this range, $H(j \omega)=0$ and the input is finite, so $\underline{Y}(j \omega)=0$.
For any other value of frequency, both the input and the frequency response are zero, so the output is obviously zero.
The above results allow us to define the system output in a piecewise fashion as:
$$\underline{Y}_{j \omega} = \begin{cases} {j \omega}, & 0.5 < \omega \leq 1 \\ j(2- \omega), & 1 < \omega \leq 1.5 \\ 0, & \text{otherwise} \end{cases} $$
Example 11.3
For the signals of example 11.2, plot: the magnitude and phase responses of the system and the magnitude and phase of both the input and output signals. The magnitude and phase response of the system are shown to the left and right below. The phase of the input is indicated as zero for all frequencies, since the input is real-valued for all frequencies. Strictly speaking, however, the phase is not well defined when the magnitude response is zero. (The phase angle provides the direction of a number from the origin of the complex plane, it is difficult to tell what direction “zero” is from itself!)
The magnitude and phase of the frequency domain input are shown below. The $90^{\circ}$ phase shift over the range of 0 to 2 rad/sec is due to the factor of “j” in the frequency response. The phase is not indicated where the input amplitude is zero; this is again because the phase angle of “zero” is not well defined.
The magnitude and phase of the output are shown below. It is easy to see from the above figures that the magnitude of the output is the product of the input magnitude and the magnitude response and the phase of the output is the sum of the input phase and the phase response.
The above system is performing a potentially useful operation. Any sinusoidal signals with frequencies between 0.5 and 1.5 rad/sec are passed through the system (they appear at the output, unchanged). Sinusoids with frequencies outside this range are eliminated by the system – they are not present in the system’s output. This system is performing what is called a band-pass operation; frequencies within a certain frequency band are passed through the system, while all other frequencies are stopped. This type of operation can be useful, for example, in communication systems – signals from different radio stations should not overlap or they will interfere with one another.
Section Summary
A very powerful analysis and design techniques for linear systems consists of considering the input and output signals to be phasors which are functions of frequency, so that the amplitude and phase of the input and output signals are both defined at each value of frequency. If this viewpoint is taken,
- The amplitude of the output signal is the frequency-by-frequency product of the amplitude of the input signal and the magnitude response of the system, and
- The phase of the output signal is the frequency-by-frequency sum of the phase of the input and the phase
response of the system.
Exercises
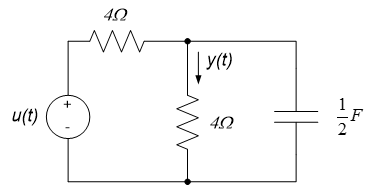
1. Calculate the frequency response for the circuit below, if $u(t)$ is the input and $y(t)$ is the output.
2. The input to a system is $u(t) = 3 \cos(2t-60^{\circ}) + 4 \cos(4t+30^{\circ}) + 7 \cos(6t+45^{\circ})$. The system frequency response is given by the piecewise function:
$$H{j \omega} = \begin{cases} 0, & 0 < \omega < 3 \\ 1, & 3 \leq \omega \leq 5 \\ 0, & \omega > 5 \end{cases} $$
11.2: Signal Spectra and Frequency Response Plots
In previous sections, we used the frequency response of a system to determine the system output, when the input to the system consists of signals comprised of one or more sinusoidal components. This analysis approach is extremely powerful, since it turns out that nearly any signal can be represented as a superposition of sinusoids1). We will ultimately, therefore, use our frequency domain analysis approaches on a very broad range of input signals, many of which may have very little resemblance to sinusoidal signals.
Often, a graphical representation of the system’s frequency response and the frequency content of the signals of interest can facilitate analysis and provide insight into the overall system behavior. We have seen an example of this in example 10.3. In this chapter, we introduce the concept of a signal’s spectrum – the frequency content of a signal – and we will look more closely at the representation of frequency responses in graphical form. We will conclude this section with an example of the use of signal spectra and frequency response plots to obtain a qualitative representation of a system’s frequency domain response to some input.
Signal Spectra
The signals currently of interest to us are sinusoidal. Any sinusoidal signal can be written in the form:
$$f(t) = A \cos(\omega_0 t + \theta) (Eq. 11.3)$$
The signal is completely defined by its amplitude, A, its frequency, $\omega_0$, and its phase angle, $\theta$. Our primary interest in these signals is as inputs and outputs to systems. As indicated in section 10.1, we can characterize systems by their magnitude and phase responses as functions of frequency. To be consistent with this frame of mind, we will consider sinusoidal signals of the type shown in equation (11.3) to be functions of frequency as well. We will thus begin to consider the frequency, $\omega$, to be an independent variable, much in the same way that time was treated as an independent variable when we determined time domain responses of first and second order systems.
With frequency treated as an independent variable, the sinusoidal signal of equation (11.3) can be re-written in terms of $\omega$:
$$F{j \omega} = \begin{cases} A \angle \theta, & \omega = \omega_0 \\ 0, & \text{otherwise} \end{cases} (Eq. 11.4) $$
The frequency domain representation of a sinusoidal signal has two dependent variables: the amplitude and the phase. Our immediate goal is to represent the frequency content of signals graphically – we will, therefore, need to use two plots: amplitude as a function of frequency and phase as a function of frequency.
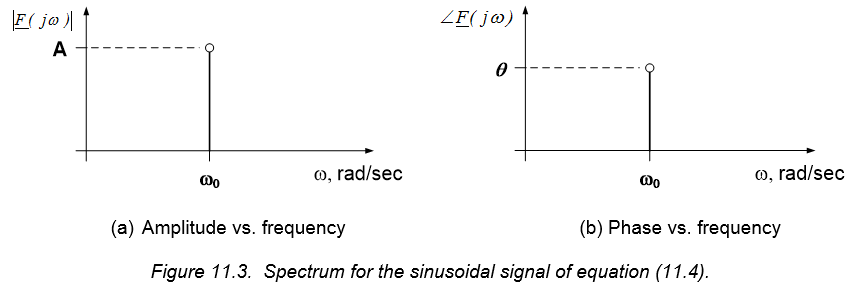
A signal’s amplitude and phase as functions of frequency is called the spectrum of the signal. If we are provided with the spectrum of the signal, we have all the information necessary to completely define the signal. Signal spectra are often presented graphically in terms of two plots; we will refer to the plot of amplitude as a function of frequency as the magnitude spectrum, while the plot of phase as a function of frequency will be called the phase spectrum. As an example, the magnitude and phase spectra of the signal provided in equation (11.4) are shown in Figure 11.3 below.
Notes:
- The term spectrum is most commonly applied to the plot of amplitude and phase vs. frequency of signals in complex exponential form. For example, the signal of equation (11.1) can be written in terms of complex exponentials as: $f(t)= \frac{Ae^{j(\omega_0 t+ \theta)} + Ae^{-j(\omega_0 t + \theta)}}{2} = \frac{A}{2}e^{j \theta} e^{j \omega_0 t} + \frac{A}{2}e^{-j \theta} e^{-j \omega_0 t}$. The spectral plot of the signal in this form is shown below. Note that spectra in this form have both positive and negative frequencies. In our discussions in this chapter, we will present spectra only in terms of having positive frequencies.
- The time domain representation of a signal has only one dependent variable – the value of the signal at any time. Time domain representations are therefore represented graphically as a single plot with time on the horizontal axis. This difference is, fundamentally, due to the fact that we do not work with complex functions of time; if we could measure a signal with both real and imaginary parts, two plots would be required.)
Example 11.4
Plot the spectrum of the voltage signal $v_{in}(t) = 3 \cos(2t+20^{\circ}) + 7cos(4t-60^{\circ})$. (Note: this is the same signal as that used in Example 10.20; for a time-domain plot of the signal, see that example.)
The phasor form of this signal can be expressed as a function of frequency as:
$$\underline{V}_{in}(j \omega) = \begin{cases} 3 \angle 20^{\circ}, & \omega=2 \text{rad/sec} \\ 7 \angle -60^{\circ}, & \omega=4 \text{rad/sec} \\ 0, & \text{otherwise} \end{cases} $$
The spectrum is shown below:
Example 11.5
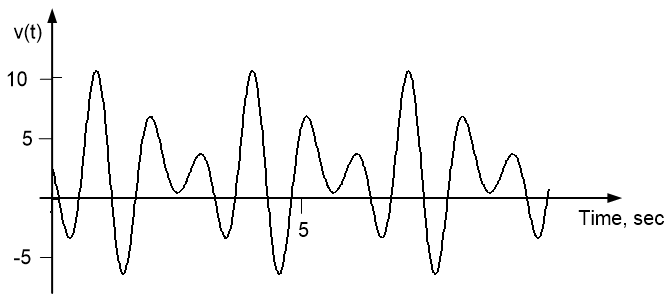
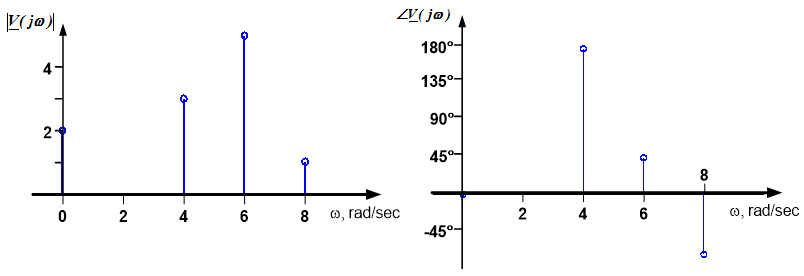
Plot the voltage signal $v(t) = 2 - 3 \cos(4t) + 5 \cos(6t+45^{\circ}) + \cos(8t-75^{\circ})$ and its spectrum.
A plot of the time domain signal is shown below.
A couple of notes should be made about the spectrum of this signal. (1) The constant (DC) value of two corresponds to a frequency of zero rad/sec, since we can write $2 = 2 \cos(0t)$. (2) Sinusoidal amplitudes are by definition positive, so the negative sign in the $-3 \cos(4t)$ term must be accounted for in the phase. Therefore, we re- write this term as $+3 \cos(4t+180^{\circ})$. The spectrum of the signal can then be plotted as shown below:
Frequency Response Plots
We have previously seen that the frequency response of a system consists of the system’s magnitude response and phase response. The magnitude response provides the gain of the system (the ratio between the amplitudes of the output and input sinusoids) as a function of frequency, while the phase response provides the change in phase between the input and output sinusoids, as a function of frequency. In this section, we will emphasize the presentation of this information graphically. We do this by plotting the frequency response of two simple first order circuits in the examples below.
Example 11.6
Plot the frequency response for the circuit shown below. The voltage $v_{in}(t)$ is the input and the capacitor voltage $v_{out}(t)$ is the desired response.
A mathematical expression for the frequency response of this circuit was determined in example 11.1 to be:
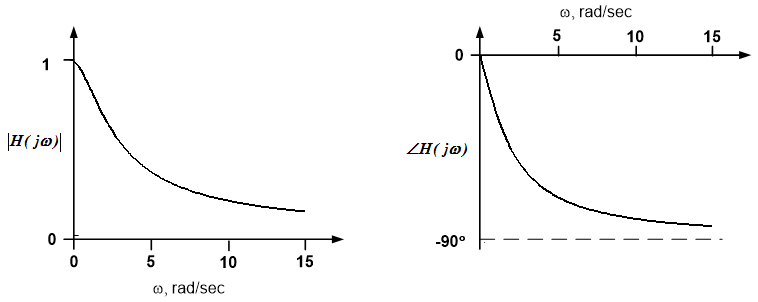
$$H(j \omega) = \frac{2}{2+ j \omega}$$
The magnitude and phase responses, as functions of frequency are, therefore:
$$|H(j \omega)| \frac{2}{\sqrt{4+\omega^2}}$$
And:
$$\angle H(j \omega) = -\tan^{-1}(\frac{\omega}{2})$$
Plotting these functions results in the graphical frequency response shown below:
Example 11.7
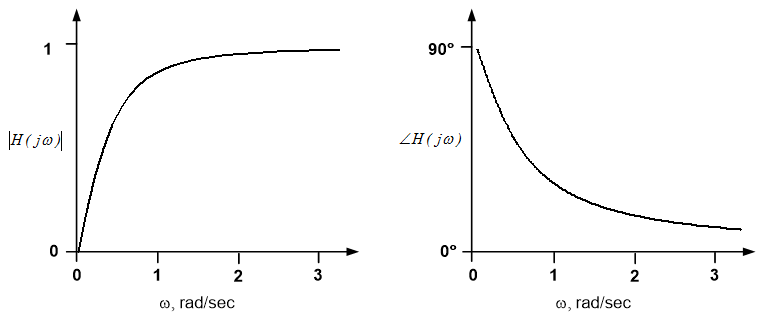
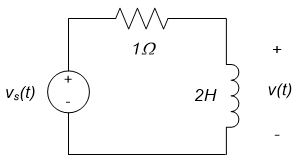
Plot the frequency response for the circuit shown to the left below. The source voltage $v_S(t)$ is the input and the inductor voltage $v(t)$ is the output.
We begin by converting the circuit to the frequency domain. Representing the input and output signals as phasors and the circuit elements as impedances results in the circuit to the right above. This circuit suggests that the output voltage can be determined from the input voltage via a voltage divider formula:
$$\underline{V} = \frac{j2 \omega}{1+j2 \omega} \cdot \underline{V}_S$$
The circuit frequency response, $H(j \omega)$, is the ratio of the output phasor to the input phasor:
$$H(j \omega) = \frac{\underline{V}}{\underline{V}_S} = \frac{j2 \omega}{1+j2 \omega}$$
So that the magnitude and phase response of the circuit are:
$$|H(j \omega)| = \frac{2 \omega}{\sqrt{1^2 + (2 \omega)^2}}$$
And:
$$\angle H(j \omega) = 90^{\circ} - \tan^{-1}(2 \omega)$$
Plots of these functions are shown below.
Checking the Frequency Response
A circuit’s amplitude response is relatively easy to determine at low and high frequencies. For very low ($\omega \rightarrow 0$) and very high ($\omega \rightarrow \infty$) frequencies, the circuit can be modeled as a purely resistive network. Since resistive networks are relatively easy to analyze (no complex arithmetic is required), this can provide a valuable tool for checking results or predicting expected behavior.
- Capacitors at low and high frequencies: A capacitor’s impedance is $Z_C = \frac{1}{j \omega C}$. At low frequencies ($\omega \rightarrow 0$), the impedance $Z_C \rightarrow \infty$, and the capacitor behaves as an open circuit. At high frequencies ($\omega \rightarrow \infty$) the impedance $Z_C \rightarrow 0$ and the capacitor behaves like a short circuit.
- Inductors at low and high frequencies: an inductor's impedance is $Z_L = j \omega L$. At low frequencies ($\omega \rightarrow 0$), the impedance $Z_L \rightarrow 0$, and the inductor behaves as a short circuit. At high frequencies ($\omega \rightarrow \infty$) the impedance $Z_L \rightarrow \infty$ and the inductor behaves like an open circuit.
Please note that the above statements are relative only to the amplitude response.
Example 11.8
Use the circuits’ low and high frequency behavior to check the amplitude response plots for example 11.6.
The circuit of interest is shown below.
- At low frequencies, the capacitor becomes an open circuit, no current flows through the resistor, and $v_{out} = v_{in}$. Thus, the amplitude of the output is the same as the amplitude of the input and the gain as $\omega \rightarrow 0$ is one.
- At high frequencies, the capacitor becomes a short circuit, so that $v_{out} = 0$. Since the output amplitude is zero, for a non-zero input, the gain of the circuit as $\omega \rightarrow \infty$ is zero.
The expected behavior at low and high frequencies agrees with the amplitude response of example 11.6; the amplitude response is one at $\omega = 0$, and approaches zero as frequency increases.
Example 11.9
Use the circuits’ low and high frequency behavior to check the amplitude response plots for example 11.7. The circuit of interest is shown below:
- At low frequencies, the inductor becomes a short circuit, so that $v = 0$. Since the output amplitude is zero, for a non-zero input, the gain of the circuit as $\omega \rightarrow 0$ is zero.
- At high frequencies, the inductor becomes an open circuit, no current flows through the resistor, and $v =v_S$. Thus, the amplitude of the output is the same as the amplitude of the input and the gain as $\omega \rightarrow \infty$ is one.
The expected behavior at low and high frequencies agrees with the amplitude response of example 11.7; the amplitude response is zero at $\omega =0$, and approaches one as frequency increases.
Example 11.10
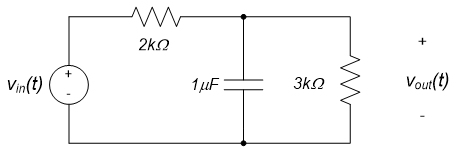
What is the gain of the circuit shown below as $\omega \rightarrow 0$ and $\omega \rightarrow \infty$? The input is $v_{in}(t)$ and the output is $v_{out}(t)$.
As $\omega \rightarrow 0$, the capacitor becomes an open circuit, and the overall circuit becomes as shown to the left below. As $\omega \rightarrow \infty$, the capacitor is replaced by a short circuit and the overall circuit becomes as shown to the right below.
As $\omega \rightarrow 0$, the circuit becomes a voltage divider, and $v_{out} = \frac{3k \Omega}{2k \Omega + 3k \Omega} \cdot v_{in}$, so that the circuit's gain is $\frac{3}{5}$. As $\omega \rightarrow \infty$, $v_{out}$ is measured across a short circuit, and the gain is zero.
Graphical Representation of System Response
We can use graphical depictions of the input signal spectrum and the frequency response of the system to obtain a graphical representation of a system’s response. This representation can be especially useful in interpreting and understanding the effect of a system on an input signal. This qualitative interpretation of a system’s response can be an invaluable aid in system design.
The frequency-domain representation of a system’s response is shown in Figure 11.4. The frequency-domain output is simply a point-by-point multiplication between the input signal and the system’s frequency response. Thus, the amplitude spectrum of the output is simply the point-by-point product of the input signal’s amplitude spectrum with the system’s magnitude response. The phase spectrum of the output is the sum of the input signal’s phase spectrum and the system’s phase response. An example of this process and its use in interpreting a system’s response is provided in the example below.
Example 11.11
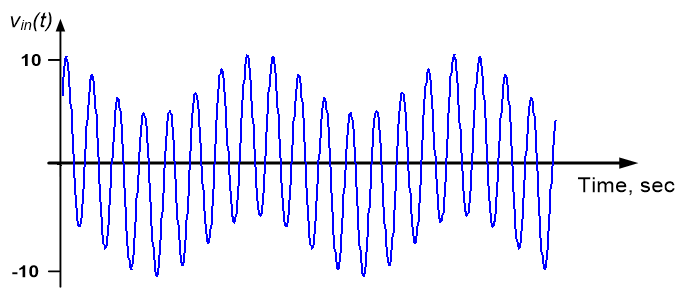
Use graphical methods to interpret the response of the circuit of example 11.6 to an input voltage $v_{in}(t) = 3 \cos(t+20^{\circ}) + 8 \cos(8t-60^{\circ})$. The input voltage time-domain signal is shown below. The signal consists of a relatively small amplitude, low frequency sinusoid superimposed with a large amplitude, higher frequency signal.
The frequency response of the circuit was determined in example 11.6; the frequency response plots are repeated below:
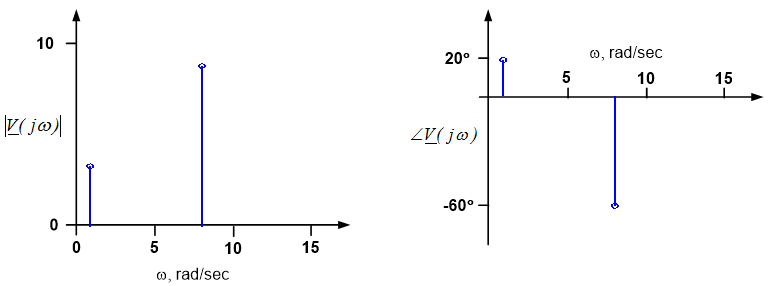
The input signal spectrum, $\underline{V}(j \omega)$ is shown below.
We can obtain the spectrum of the output signal from a frequency-by-frequency product of the input amplitude and the circuit’s amplitude response and a frequency-by-frequency sum of the input phase and the circuit’s phase response. Keep in mind that when the input amplitude is zero, the output amplitude is also zero and the phase is undetermined.
This process results in the output spectrum shown below. Notice that the circuit attenuates the magnitude of the high frequency component of the signal relative to the low frequency component. The low frequency component is said to be “passed through” the circuit, while the higher frequency component is “stopped” by the circuit.
The time-domain signal of the output signal is shown below, superimposed over the input signal. It is clear that the amplitudes of the higher frequency component of the output signal has been reduced relative to the amplitude of the lower frequency component. This circuit is said to be frequency selective – it selects low frequencies to pass and high frequencies to stop.
Section Summary
- Signal spectra are a primarily a graphical representation of the frequency content of a signal. The spectrum consists, in general, of two plots: amplitude as a function of frequency and phase as a function of frequency.
- The signal spectrum is useful, since many signals of interest can be expressed as a superposition of sinusoidal components. This allows signals which do not appear “sinusoidal” to be analyzed using steady-state sinusoidal analysis techniques.
- Frequency response plots are a graphical representation of the frequency response of a system. Frequency response plots also consist of two parts: the system’s magnitude response as a function of frequency and the system’s phase response as a function of frequency.
- The combination of the signal spectrum and the frequency response plots can provide valuable insight into a system’s operation. The amplitude of the output signal is the point-by-point product of the input signal’s amplitude and the system’s magnitude response. The phase of the output signal is the point-by-point sum of the input signal’s phase and the system’s phase response.
- Perhaps even more importantly, the signal spectra and frequency response plots can be used as an effective design tool: if the frequency content of the input signal and the desired frequency content of the output signal are both known, we can determine the system frequency response necessary to provide the desired output signal. This allows us to design our system to perform the desired task
- When calculating a system’s frequency response, it is always important to check your result relative to the expected behavior of the system. This can be done by determining the magnitude response at very low ($\omega \rightarrow 0$) and very high ($\omega \rightarrow \infty$) frequencies. In these extreme conditions the circuit can be approximated as a purely resistive circuit, since energy storage elements can be replaced by either short-circuits or open-circuits as follows:
- Capacitors at low and high frequencies: A capacitor’s impedance is $Z_C=\frac{1}{j \omega C}$. At low frequencies ($\omega \rightarrow 0$), the impedance $Z_C \rightarrow \infty$, and the capacitor behaves as an open circuit. At high frequencies ($\omega \rightarrow \infty$) the impedance $Z_C \rightarrow 0$ and the capacitor behaves like a short circuit.
- Inductors at low and high frequencies: A inductor’s impedance is $Z_L = j \omega L$. At low frequencies ($\omega \rightarrow 0$), the impedance $Z_L \rightarrow 0$, and the inductor behaves as a short circuit. At high frequencies ($\omega \rightarrow \infty$) the impedance $Z_L \rightarrow \infty$ and the inductor behaves like an open circuit.
Exercises
1. The input to a system is $u(t) = 3 \cos(2t-60^{\circ}) + 4 \cos(4t+30^{\circ}) + 7 \cos(6t+45^{\circ})$. The system frequency response is given by the piecewise function:
$$H(j \omega) = \begin{cases} 0, & 0< \omega < 3 \\ 1, & 3 \leq \omega \leq 5 \\ 0, & \omega > 5 \end{cases} $$
Sketch:
- The spectrum of the input signal (magnitude and phase)
- The frequency response of the system (magnitude response and phase response)
- And the output signal spectrum.
Compare your sketches to your results of exercise 2 in section 1.11.
2. Sketch the spectrum for the signal $v(t)=4+3 \cos(2t-45^{\circ}) + 2 \cos(4t+45^{\circ})$.
3. Use the circuit behavior at high and low frequencies to check the frequency response you calculated for the circuit of exercise 1 in section 11.1.
4. Determine the steady-state response of the output $y(t)$ for the circuit below at very low and very high frequencies.
11.3: Frequency Selective Circuits and Filters
It is common to categorize circuits by the overall “shape” of their magnitude response. As we saw in example 11.11, in some frequency ranges the output amplitude may be high relative to the input amplitude, while in other frequency ranges the output amplitude will be low relative to the input amplitude. If the output amplitude at some frequency is high relative to the input amplitude, the magnitude response at that frequency is “large” and that frequency is said to be passed by the circuit. Conversely, if the output amplitude at some frequency is low relative to the input amplitude, the magnitude response at that frequency is “small” and that frequency is said to be stopped by the circuit.
Circuits which select certain frequencies to pass and other frequencies to stop are called frequency selective circuits or filters (since they tend to “filter out” certain frequency ranges of the input signal). The range of frequencies which are passed are called the passband of the filter, and the range of frequencies which are stopped are called the stopband of the filter. There are four primary categories of filters:
- Low-pass filters pass low frequencies and stop high frequencies
- High-pass filters pass high frequencies and stop low frequencies
- Band-pass filters pass a range of frequencies between two ranges of stopped frequencies
- Band-reject filters stop a range of frequencies between two ranges of passed frequencies
Filters are also categorized by their order. The order of the filter is simply the order of the differential equation governing the filter. Thus a first-order filter is governed by a first-order differential equation, a second-order filter is governed by a second-order differential equation, and so on. Low-pass and high-pass filters can be any order, while band-pass and band-stop filters must be at least second order.
In this chapter, we restrict out attention to first order filters, so we will consider only low pass and high pass filters.
Ideal Low-pass and High-pass Filters
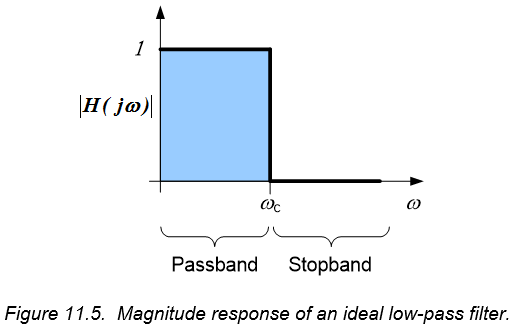
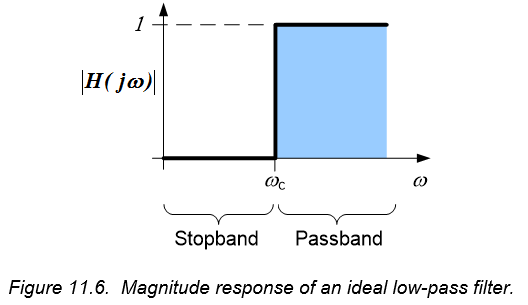
We will first introduce the basic concepts relative to first order filters in the context of ideal filters. It must be clearly understood that ideal filters are not physically realizable – that is, we cannot construct a physical system which can perform this way2). Ideal filters entirely stop all input signals in the stopband and completely pass all signals in the passband. Thus, the magnitude response of an ideal filter is exactly one in the passband and exactly zero in the stop band. First order filters can be either high-pass or low-pass filters.
An ideal low pass filter has a magnitude response as shown in Figure 11.5. The passband is shown as the shaded area under the magnitude response. The magnitude response is discontinuous – it goes from one to zero instantaneously. The cutoff frequency, $\omega_c$, defines the boundary between the passband and the stopband. Any signal with a frequency below $\omega_c$ is passed through the filter without any attenuation; any signal with a frequency above $\omega_c$ is entirely stopped by the filter – it is not present in the output signal.
An ideal high-pass filter has a magnitude response as shown in Figure 11.6. The passband is again shown as the shaded area under the magnitude response. The magnitude response is discontinuous – it goes from zero to one instantaneously. The cutoff frequency, $\omega_c$, again defines the boundary between the passband and the stopband. Any signal with a frequency below $\omega_c$ is entirely stopped by the filter while any signal with a frequency above $\omega_c$ is passed through the filter with no amplitude change.
As previously noted, it is impossible to physically implement an ideal filter. Thus, all electrical circuits implement non-ideal filters. Non-ideal filters do not provide an instantaneous transition between the pass band and the stop band. Non-ideal first order filters are discussed in the following subsections.
First Order Low-pass Filters
The form of the governing differential equation for a first order low pass filter can be written as:
$$\frac{dy(t)}{dt} + \omega_c y(t) = K \cdot u(t) (Eq. 11.5)$$
The frequency response of the filter can be determined to be:
$$H(j \omega) = \frac{K}{j \omega + \omega_c} (Eq. 11.6)$$
The magnitude response of the filter is thus:
$$|H(j \omega)| = \frac{K}{\sqrt{\omega^2 + \omega^2_c}} (Eq. 11.7)$$
The maximum magnitude response is $\frac{K}{\omega_c}$ when $\omega = 0$ and the magnitude response is zero as $\omega \rightarrow \infty$. Thus, the filter is passing low frequencies and stopping high frequencies. The differential equation describes a low-pass filter.
The magnitude response of the filter is shown in Figure 11.7. The frequency response is a smooth curve, rather than the discontinuous function shown in Figure 11.5. There is no single frequency that obviously separates the passband from the stopband, so we must choose a relatively arbitrary point to define the boundary between the passband and the stopband. By consensus, the cutoff frequency for a low-pass filter is defined as the frequency at which the magnitude response is $\frac{1}{\sqrt{2}}$ times the magnitude response at $\omega = 0$. For the magnitude response given by equation (11.7), the cutoff frequency is $\omega = \omega_c$. This point is indicated on Figure 11.7.

First Order High-pass Filters
The form of the governing differential equation for a first order low pass filter can be written as:
$$\frac{dy(t)}{dt} + \omega_c y(t) = K \cdot \frac{du(t)}{dt} (Eq. 11.8)$$
The frequency response of the filter can be determined to be:
$$H(j \omega) = \frac{jK \omega}{j \omega + \omega_c} (Eq. 11.9)$$
The magnitude response of the filter is thus:
$$|H(j \omega)| = \frac{K \omega}{\sqrt{\omega^2 + \omega^2_c}} (Eq. 11.10)$$
The maximum magnitude response is approximately K when $\omega \rightarrow \infty$ and the magnitude response is zero at $\omega = 0$. Thus, the filter is passing high frequencies and stopping low frequencies. The differential equation describes a high-pass filter.
The magnitude response of the filter is shown in Figure 11.8. As with the non-ideal low-pass filter, the frequency response is a smooth curve, rather than the discontinuous function shown in Figure 11.6. Again, there is no single frequency that obviously separates the passband from the stopband, so we must choose a relatively arbitrary point to define the boundary between the passband and the stopband. Consistent with our choice of cutoff frequency for the low-pass filter, the cutoff frequency for a high-pass filter is defined as the frequency at which the magnitude response is $\frac{1}{\sqrt{2}}$ times the magnitude response at $\omega \rightarrow \infty$. For the magnitude response given by equation (1.10), the cutoff frequency is $\omega = \omega_c$. This point is indicated on Figure 11.8.

Notes:
- The cutoff frequency is also called the corner frequency, the 3dB frequency, or the half-power point.
- The cutoff frequency for both low-pass and high-pass filters is defined as the frequency at which the magnitude is $\frac{1}{\sqrt{2}}$ times the maximum value of the magnitude response.
- It can be seen from examples in section 11.2 that the phase response of a first order low-pass filter is $0^{\circ}$ at $\omega = 0$ and decreases to $-90^{\circ}$ as $\omega \rightarrow \infty$. The phase response is $-45^{\circ}$ at the cutoff frequency.
- It can be seen from examples in section 11.2 that the phase response of a first order high-pass filter is $90^{\circ}$ at $\omega = 0$ and decreases to $0^{\circ}$ as $\omega \rightarrow \infty$. The phase response is $45^{\circ}$ at the cutoff frequency.
- For both low-pass and high-pass filters, the cutoff frequency is the inverse of the time constant for the circuit, so that $\omega_c = \frac{1}{\tau}$.
- The circuit’s response at zero frequency is generally an important parameter to consider. This is called the DC gain, and is the ratio of the output amplitude to the input amplitude for a constant input. A constant input corresponds to a cosine with zero frequency. Low pass filters have a relatively high DC gain and a correspondingly large response to a constant input. High pass filters have a low DC gain; they have little or no response to constant inputs.
We conclude this section with examples of circuits from section 10.2 which implement low-pass and high-pass filter operations.
Example 11.12: First Order Low-pass Filter
The circuit below is the circuit from example 11.6. The input is $v_{in}(t)$ and the output is $v_{out}(t)$.
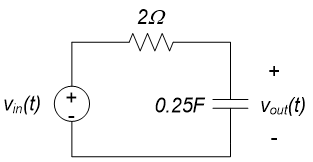
In example 11.6, the frequency response was determined to be:
$$H(j \omega) = \frac{2}{2+ j \omega}$$
The maximum value of the magnitude response is one at a frequency of zero radians/second and the magnitude response goes to infinity as $\omega \rightarrow \infty$, so the circuit acts as a low-pass filter. Comparing the amplitude response above with equation (2) above, it can be seen that the cutoff frequency is $\omega_c = 2$ rad/sec. The amplitude response, with the cutoff frequency labeled, is shown below.

Example 11.13: First Order High-pass Filter
The circuit below is the circuit from example 11.7. The input is $v_s(t)$ and the output is $v(t)$.

The frequency response of the circuit was previously determined to be:
$$H(j \omega) = \frac{\underline{V}}{\underline{V}_S} = \frac{j2 \omega}{1+ j2 \omega}$$
The maximum value of the magnitude response is one as $\omega \rightarrow \infty$ and goes to zero at a frequency of zero radians/second, so the circuit acts as a low-pass filter. Comparing the amplitude response above with equation (4) above, it can be seen that the cutoff frequency is $\omega_c = 0.5$ rad/sec. The amplitude response, with the cutoff frequency labeled, is shown below.

Section Summary
- Filters are frequency-selective systems. These systems provide a desired relationship between the input signal spectrum and the output signal spectrum. The filter does this by passing certain frequencies from the input to the output and stopping some frequencies from propagating from the input to the output. Nomenclature is as follows:
- The range of frequencies which are passed is called the passband of the filter
- The range of frequencies which are stopped is called the stopband of the filter
- Filters are broadly categorized as follows:
- Low-pass filters pass low frequencies and stop high frequencies
- High-pass filters pass high frequencies and stop low frequencies
- Band-pass filters pass a range of frequencies between two ranges of stopped frequencies
- Band-reject filters stop a range of frequencies between two ranges of passed frequencies
- In this chapter, we were concerned only with first-order low-pass and high-pass filters. These filters are primarily characterized by the following parameters:
- Cutoff frequency: the cutoff is defined as the frequency at which the magnitude is $\frac{1}{\sqrt{2}}$ times the maximum value of the magnitude response.
- DC gain: the DC gain is the ratio of the output amplitude to the input amplitude for a constant input (a cosine function with zero frequency). Low pass filters have a relatively high DC gain and a correspondingly large response to a constant input. High pass filters have a low DC gain; they have little or no response to constant inputs.
Exercises
1. What is the cutoff frequency of the circuit below? (You may want to use your results from exercise 1 of section 11.1.).

2. Use the circuit behavior at high and low frequencies and your time constant calculated in exercise 1 above to sketch the frequency response of the circuit of exercise 1. Label your frequency response to include DC gain and cutoff frequency. Is the circuit a high-pass or low-pass filter?
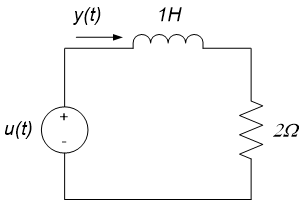
3. Calculate the time constant and the cutoff frequency for the circuit below, if u(t) is the input and $y(t)$ is the output. Verify that the cutoff frequency is the inverse of the time constant. Use the circuit behavior at high and low frequencies to determine whether the circuit is a high-pass or low-pass filter.
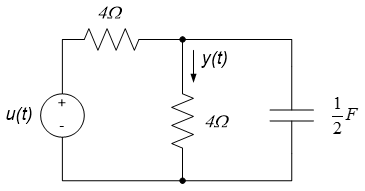
4. Calculate the frequency response of the circuit of exercise 3. Compare your frequency response to your results of exercise 3. Resolve any differences between the two.
11.4: Introduction to Bode Plots
Plotting a systems’ frequency response on a linear scale, as done in sections 11.3 and 11.4, has a number of drawbacks, especially for higher-order systems3). An alternate format for plotting frequency responses, called a Bode plot, is therefore commonly used4). On Bode plots, the amplitude response is essentially presented as a log-log plot, while the phase response is a semi-log plot. Some reasons for this are:
- Use of logarithms converts the operation of multiplication and division to addition and subtraction. This can simplify the creation of frequency response plots for higher order systems.
- Frequencies and amplitudes of interest commonly span many orders of magnitude. Logarithmic scales improve the presentation of this type of data.
- Human senses are fundamentally logarithmic. The use of logarithmic scales is therefore more “natural”. (This is the reason for use of the Richter scale in measuring earthquake intensity, and the decibel scale in measuring sound levels. It is also the reason that increasing a musical tone by one octave corresponds to doubling its frequency.)
Properties of Logarithms
Since Bode plots employ logarithms extensively, we will briefly review some of the basic properties of logarithms before proceeding further. Bode plots rely upon base-10 logarithms ($log_{10}$), so we will restrict our attention to base-10 logarithms.
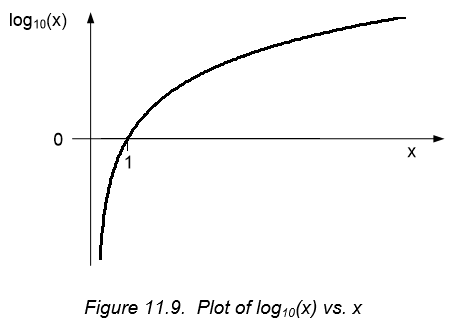
A plot of $log_{10}(x)$ vs. $x$ is shown in Figure 11.9 below. A few important features to note are:
- $log_{10}(x)$ is a real number only for positive values of x.
- $log_{10}(x)$ asymptotically approaches $-\infty$ as $x \rightarrow 0$. The slope of $log_{10}(x)$ becomes very large as $x \rightarrow 0$.
- The slope of $log_{10}(x)$ becomes small as $x \rightarrow \infty$.
- From the comments above relative to the slope of $log_{10}(x)$, it can be seen that the sensitivity of $log_{10}(x)$ to variations in $x$ decreases as $x$ increases (this is the reason why logarithmic scales are used when large variations in $x$ are encountered – as in Richter scales and musical scales).
- $log_{10}(1) = 0$
The basic defining property of a base-10 logarithm is that $x=10^y$, then $y = log_{10} x$. This property leads to the following rules governing logarithmic operations:
1. Logarithms convert multiplication and division to addition and subtraction, respectively. Thus,
$$log_{10}(xy) = log_{10}x+log_{10}y$$
And:
$$log_{10} \left( \frac{x}{y} \right) = log_{10}x-log_{10}y$$
This property is especially useful for us, since determining the spectrum of an output signal results from the product of an input signal’s spectrum with the frequency response. Thus, the output spectrum on a logarithmic scale can be obtained from a simple addition.
2. Logarithms convert exponentiation to multiplication by the exponent, so that:
$$log_{10}(x^n)=nlog_{10}x$$
Decibel Scales
Magnitude responses are often presented in terms of decibels (abbreviated dB). Decibels are a logarithmic scale. A magnitude response is presented in units of decibels according to the following conversion:
$$|H(j \omega)|_{dB} = 20log_{10} (|H(j \omega)|) (Eq. 11.11)$$
Strictly speaking, magnitudes in decibels are only appropriate if the amplitude response is unitless (e.g. the units of the input and output must be the same in order for the logarithm to be a mathematically appropriate operation). However, in practice, magnitude responses are often presented in decibels regardless of the relative units of the input and output – thus, magnitude responses are provided in decibels even if the input is voltage and the output is current or vice-versa.
Brief Historical Note
Decibel units are related to the unit “bel”, which are named after Alexander Graham Bell. Units of bels are, strictly speaking, applicable only to power. Power in bels is expressed as $log_{10}( \frac{P}{P}_{ref} )$, where $P_{ref}$ is a “reference” power. Bels are an inconveniently large unit, so these were converted to decibels, or tenths of a bel. Thus, power in decibels is $10log_{10}(\frac{P}{P}_{ref})$. Since the units of interest to electrical engineers are generally voltages or currents, which must be squared to obtain power, we obtain $20log_{10}(|H(j \omega)|)$. The significant aspect of the decibel unit for us is not, however, the multiplicative factor of “20”), but the fact that the unit is logarithmic.
We conclude this subsection with a table of common values for $|H(j \omega)|$ and their associated decibel values.

Bode Plots
Bode plots are simply plots of the magnitude and phase response of a system using a particular set of axes. For Bode plots,
- Units of frequency are on a base-10 logarithm scale.
- Amplitudes (or magnitudes) are in decibels (dB)
- Phases are presented on a linear scale
Notes
- Since frequencies are on a logarithmic scale, frequencies separated by the same multiplicative factor are evenly separated on a logarithmic scale. Some of these multiplicative factors have special names. For example, frequencies separated by a factor of two are said to be separated by octaves on a logarithmic scale and frequencies separated by a factor of 10 are said to be separated by decades.
- Since decibels are intrinsically a logarithmic scale, magnitudes which are separated by the same multiplicative factor are evenly separated on a decibel scale. For example, magnitudes which are separated by a factor of 10 are separated by 20dB on a decibel scale.
One convenient aspect of the presentation of frequency responses in terms of Bode plots is the ability to generate a reasonable sketch of a frequency response very easily. In general, this approach consists of approximating the Bode plot of a system by its asymptotic behavior as a set of straight lines. This is called a “straight line approximation” of the Bode plot; the approach is illustrated for a typical low-pass filter in the following subsection.
Bode Plots for First Order Low-pass Filters
The frequency response of a general first order low-pass filter is provided in section 11.3 as:
$$H(j \omega) = \frac{K}{j \omega + \omega_c} (Eq. 11.12)$$
Thus, magnitude response of the circuit is:
$$|H(j \omega)| = \frac{K}{\sqrt{\omega^2 + \omega^2_c}} (Eq. 11.13)$$
And the phase response of the circuit is:
$$\angle H(j \omega) = -\tan^{-1} \left( \frac{\omega}{\omega_c} \right) (Eq. 11.14)$$
To estimate the asymptotic behavior of the frequency response, we consider the behavior of equations (11.13) and (11.14) for the low frequency and high frequency cases. In general, we consider “low” frequencies to be frequencies which are less than a factor of 10 below the cutoff frequency (i.e. $\omega < \frac{\omega_c}{10}$, or frequencies more than a decade below the cutoff frequency). High frequencies are typically assumed to be frequencies which are more than a factor of 10 above the cutoff frequency (i.e. $\omega > 10 \omega_c$, or more than a decade above the cutoff frequency). We consider the high and low frequency cases separately below.
- Low frequencies:
- The magnitude response given by equation (2) is $|H(j \omega)| = \frac{K}{\sqrt{\omega^2 + \omega^2_c}}$. If $\omega << \omega$, the denominator is approximately $\sqrt{\omega^2_c}=\omega_c$ and the magnitude response $|H(j \omega)| \approx \frac{K}{\omega_c}$. If $\omega << \omega_c$, $\frac{\omega}{\omega_c} \approx 0$ and the phase response is approximately $\angle H(j \omega) \approx -\tan^{-1}(0) = 0^{\circ}$.
- High frequencies:
- If $\omega >> \omega_c$, the denominator of the amplitude response is $\sqrt{\omega^2 + \omega^2_c} \approx \sqrt{\omega^2} = \omega$. Therefore, for high frequencies, the magnitude response $|H(j \omega)| \approx \frac{K}{\omega}$. If, for high frequencies, we increase the frequency by a factor of 10, we reduce the magnitude response by 20dB (since $|H(j \cdot 10 \omega)| \approx \frac{K}{10 \omega} = 0.1 \frac{K}{\omega}$ and the multiplicative factor of 0.1 corresponds to -20dB). Thus, for frequencies well above the cutoff frequency the magnitude response, presented in Bode plot form, decreases by 20dB/decade. When $\omega >> \omega_c$, the phase response is given by $\angle H(j \omega) = -\tan^{-1} \left( \frac{\omega}{\omega_c} \right) \approx -\tan^{-1} (\infty) = -90^{\circ}$.
Summary: Low-pass Filter Straight-line Bode Plot Approximations
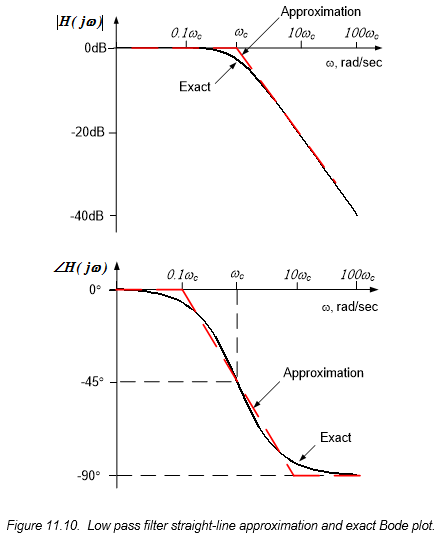
The straight line approximation to the magnitude response is constant below the cutoff frequency, with a value (in decibels) of $20log_{10} \left( \frac{K}{\omega_c} \right)$. Above the cutoff frequency, the Bode plot straight-line approximation has a constant slope of -20 dB/decade.
The straight-line approximation to the phase response is zero degrees up to a frequency of $\frac{\omega_c}{10}$ and is $-90^{\circ}$ above a frequency of $10 \omega_c$. A straight line is used ot connect the $\frac{\omega_c}{10}$ and $10 \omega_c$ frequencies.
A straight-line approximation to the Bode plot for a typical low-pass circuit, with $K = \omega_c$ (so that the frequency response is $H(j \omega) = \frac{\omega_c}{j \omega + \omega_c}$ and the DC gain is 1, or 0dB) along with an exact curve is provided below in Figure 11.10.
We conclude this section with a numerical example of the straight-line approximation to a Bode plot for a specific circuit.
Example 11.14
Sketch a straight-line approximation to the Bode plot for the circuit below. The input is $v_{in}(t)$ and the output is $v_{out}(t)$.

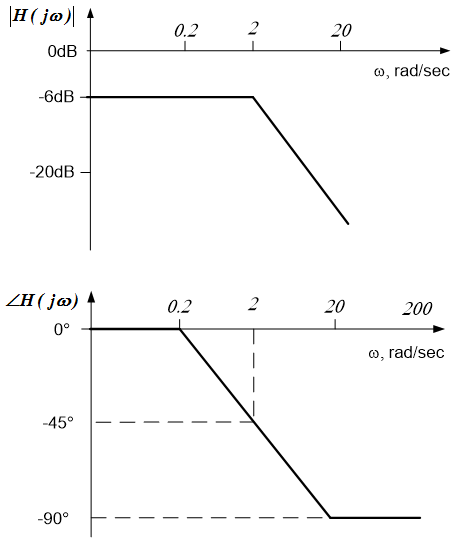
The frequency response for this circuit is $H(j \omega) = \frac{1}{j \omega + 2}$. Therefore, the cutoff frequency is $\omega_c=2$ rad/sec and the gain in decibels at low frequencies is $|H(j0)|_{dB} = 20log_{10} \left( \frac{1}{2} \right) \approx -6dB$. Thus, the straight-line magnitude response is -6dB below the cutoff frequency and decreases by 20dB/decade above the cutoff frequency. The straight-line phase response is $0^{\circ}$ below 0.2rad/sec, $-90^{\circ}$ above 20 rad/sec and a straight line between these frequencies. The associated plots are shown below.
Section Summary
- Bode plots are a very useful format for plotting frequency responses. Bode plots provide magnitude responses and phase responses in the following format:
- Units of frequency are on a base-10 logarithm scale.
- Amplitudes (or magnitudes) are in decibels (dB)
- Phases are presented on a linear scale.
- Magnitude responses in decibels are calculated according to:
$$|H(j \omega)|_{dB} = 20log_{10}(|H(j \omega)|)$$
- The use of logarithmic scales in Bode plots has a number of advantages. Logarithms convert multiplication and division into addition and subtraction, respectively. This provides a significant mathematical simplification in the analysis of higher-order systems. Logarithms are also, in some sense, more “natural” to interpret, since human senses are fundamentally logarithmic.
- Bode plots also have the advantage of being approximated fairly well by straight-line approximations. This allows the engineer to sketch a fairly accurate frequency response plot with only a minimal number of calculations.
Exercises
1. Sketch a Bode plot (straight-line approximation) for the circuit below.

2. Sketch a Bode plot (straight-line approximation) for the circuit below.
