Real Analog: Chapter 10
- Chapter 10 Materials
-
- Lecture Material:
- Lecture 25 PowerPoint Slides: Introduction to steady-state sinusoidal analysis, system response to complex units, phasor representation of sinusoids
- Lecture 26 PowerPoint Slides: Phasor diagrams, phasor representations of circuit elements
- Lecture 27 PowerPoint Slides: Impedance and admittance, steady-state sinusoidal analysis
- Lecture 28 PowerPoint Slides: Frequency domain system characterization, frequency response
- Chapter 10 Videos:
- Lab 10 Video 1: Measuring Gain & Phase: Measuring steady-state sinusoidal responses of circuits and estimating gain and phase differences between sinusoidal signals.
- Lab 10 Video 2: Impedance Measurement: Gain and phase measurement in terms of impedance.
-
-
- Exercise Solutions: Chapter 10 exercise solutions
- Homework: Chapter 10 homework problems
10. Introduction and Chapter Objectives
We will now study dynamic systems which are subjected to sinusoidal forcing functions. Previously, in our analysis of dynamic systems, we determined both the unforced response (or homogeneous solution) and the forced response (or particular solution) to the given forcing function. In the next several chapters, however, we will restrict our attention to only the system’s forced response to a sinusoidal input; this response is commonly called the sinusoidal steady-state system response. This analysis approach is useful if we are concerned primarily with the system’s response after any initial conditions have died out, since we are ignoring any transient effects due to the system’s natural response.
Restricting our attention to the steady-state sinusoidal response allows a considerable simplification in the system analysis: we can solve algebraic equations rather than differential equations. This advantage often more than compensates for the loss of information relative to the systems natural response. For example it is often the case that a sinusoidal input is applied for a very long time relative to the time required for the natural response to die out, so that the overall effects of the initial conditions are negligible.
Steady-state sinusoidal analysis methods are important for several reasons:
- Sinusoidal inputs are an extremely important category of forcing functions. In electrical engineering, for example, sinusoids are the dominant signal in the electrical power industry. The alternating current (or AC) signals used in power transmission are, in fact, so pervasive that many electrical engineers commonly refer to any sinusoidal signal as “AC”. Carrier signals used in communications systems are also sinusoidal in nature.
- The simplification associated with the analysis of steady state sinusoidal analysis is often so desirable that system responses to non-sinusoidal inputs are interpreted in terms of their sinusoidal steady-state response. This approach will be developed when we study Fourier series.
- System design requirements are often specified in terms of the desired steady-state sinusoidal response of the system.
In section 10.1 of this chapter, we qualitatively introduce the basic concepts relative to sinusoidal steady state analyses so that readers can get the “general idea” behind the analysis approach before addressing the mathematical details in later sections. Since we will be dealing exclusively with sinusoidal signals for the next few chapters, section 10.2 provides review material relative to sinusoidal signals and complex exponentials. Recall from chapter 8 that complex exponentials are a mathematically convenient way to represent sinusoidal signals. Most of the material in section 10.2 should be review, but the reader is strongly encouraged to study section 10.2 carefully – we will be using sinusoids and complex exponentials extensively throughout the remainder of this text, and a complete understanding of the concepts and terminology is crucial. In section 10.3, we examine the forced response of electrical circuits to sinusoidal inputs; in this section, we analyze our circuits using differential equations and come to the important conclusion that steady-state response of a circuit to sinusoidal inputs is governed by algebraic equations. Section 10.4 takes advantage of this conclusion to perform steady-state sinusoidal analyses of electrical circuits without writing the governing differential equation for the circuit! Finally, in section 10.5, we characterize a system’s response purely by its effect on a sinusoidal input. This concept will be used extensively throughout the remainder of this textbook.
After Completing this Chapter, You Should be Able to:
- State the relationship between the sinusoidal steady state system response and the forced response of a system
- For sinusoidal steady-state conditions, state the relationship between the frequencies of the input and output signals for a linear, time-invariant system
- State the two parameters used to characterize the sinusoidal steady-state response of a linear, time-invariant system
- Define periodic signals
- Define the amplitude, frequency, radian frequency, and phase of a sinusoidal signal
- Express sinusoidal signals in phasor form
- Perform frequency-domain analyses of electrical circuits
- Sketch phasor diagrams of a circuit’s input and output
- State the definition of impedance and admittance
- State, from memory, the impedance relations for resistors, capacitors, and inductors
- Calculate impedances for resistors, capacitors, and inductors
- State how to use the following analysis approaches in the frequency domain:
- KVL and KCL
- Voltage and current dividers
- Circuit reduction techniques
- Nodal and mesh analysis
- Superposition, especially when multiple frequencies are present
- Thévenin’s and Norton’s theorems
- Determine the load impedance necessary to deliver maximum power to a load
- Define the frequency response of a system
- Define the magnitude response and phase response of a system
- Determine the magnitude and phase responses of a circuit
10.1: Introduction to Steady-state Sinusoidal Analysis
In this chapter, we will be almost exclusively concerned with sinusoidal signals, which can be written in the form:
$$f(t) = A \cos (\omega t+ \theta) (Eq. 10.1)$$
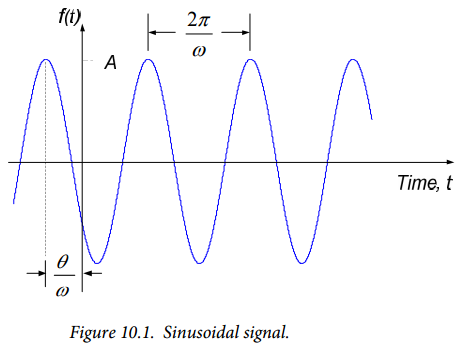
where $A$ is the amplitude of the sinusoid, $\omega$ is the angular frequency (in radians/second) of the signal, and $\theta$ is the phase angle (expressed in radians or degrees) of the signal. $A$ provides the peak value of the sinusoid, $\omega$ governs the rate of oscillation of the signal, and $\theta$ affects the translation of the sinusoid in time. A typical sinusoidal signal is shown in Figure 10.1.
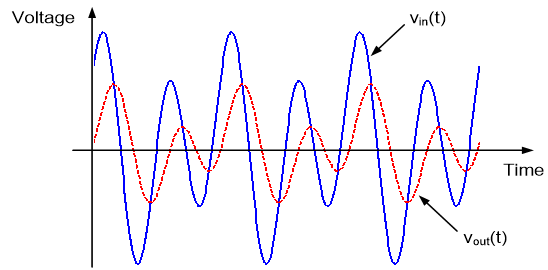
If the sinusoidal signal of Figure 10.1 is applied to a linear time invariant system, the response of the system will consist of the system’s natural response (due to the initial conditions on the system) superimposed on the system’s forced response (the response due to the forcing function). As we have seen in previous chapters, the forced response has the same form as the forcing function. Thus, if the input is a constant value the forced response is constant, as we have seen in the case of the step response of a system. In the case of a sinusoidal input to a system, the forced response will consist of a sinusoid of the same frequency as the input sinusoid. Since the natural response of the system decays with time, the steady state response of a linear time invariant system to a sinusoidal input is a sinusoid, as shown in Figure 10.2. The amplitude and phase of the output may be different than the input amplitude and phase, but both the input and output signals have the same frequency.
It is common to characterize a system by the ratio of the magnitudes of the input and output signals ($\frac{B}{A}$ in Figure 10.2) and the difference in phases between the input and output signals ($\phi - \theta$) in Figure 10.2) at a particular frequency. It is important to note that the ratio of magnitudes and difference in phases is dependent upon the frequency of the applied sinusoidal signal.
Example 10.1: Series RLC Circuit Response
Consider the series RLC circuit shown in Figure 10.3 below. The input voltage to the circuit is given by:
$$v_s(t) = \begin{cases} 0, t < 0 \\ \cos(5t), t \geq 0 \\ \end{cases}$$
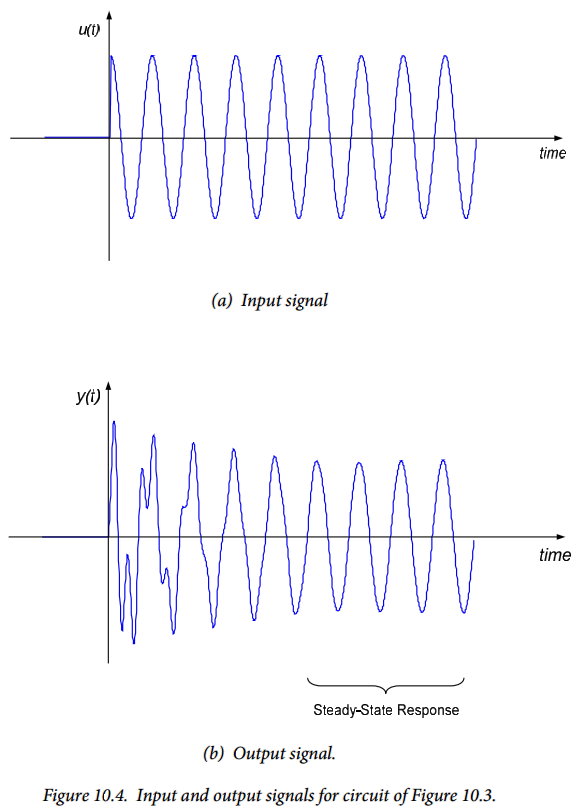
Thus, the input is zero prior to $t = 0$, and the sinusoidal input is suddenly “switched on” at time $t = 0$. The input forcing function is shown in Figure 10.4(a). The circuit is “relaxed” before the sinusoidal input is applied, so the circuit initial conditions are:
$$y(0^-) = \frac{dy}{dt} |_{t=0^-} = 0$$
This circuit has been analyzed previously in Chapter 8, and the derivation of the governing differential equation will not be repeated here. The full output response of the circuit is shown in Figure 10.4(b). The natural response of the circuit is readily apparent in the initial portion of the response but these transients die out quickly, leaving only the sinusoidal steady-state response of the circuit. It is only this steady state response in which we will be interested for the next several modules. With knowledge of the frequency of the signals, we can define both the input and (steady-state) output by their amplitude and phase, and characterize the circuit by the ratio of the output-to-input amplitude and the difference in the phases of the output and input.
Section Summary
- Sinusoidal signals can be expressed mathematically in the form:
$$f(t) = A \cos(\omega t + \theta)$$
- In the above, $A$ is the amplitude of the sinusoid, it describes the maximum and minimum values of the signal.
- In the above, $\theta$ is the phase angle of the sinusoid, it describes the time shift of the sinusoid relative to a pure cosine.
- In the above, $\omega$ is the radian frequency of the sinusoid. The sinusoid repeats itself at time intervals of $\frac{2\pi}{\omega}$ seconds.
- A sinusoidal signal is completely described by its frequency, its amplitude, and its phase angle.
- The steady-state response of a linear, time-invariant system to a sinusoidal input is a sinusoid with the same frequency.
- Since the frequencies of the input and output are the same, the relationship between the input and output sinusoids is completely characterized by the relationships between:
- The input and output amplitudes.
- The input and output phase angles.
Exercises
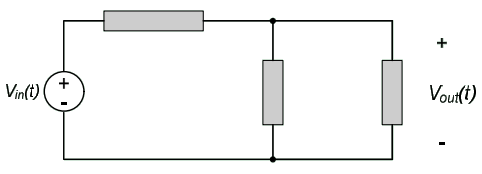
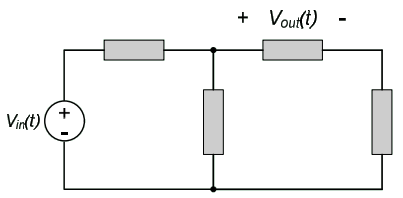
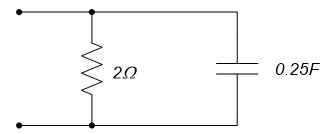
1. In the circuit below, all circuit elements are linear and time invariant. The input voltage $V_{in}(t)=10 \cos(2t+40^{\circ})$. What is the radian frequency of the output voltage $V_{out}(t)$?
2. In the circuit below, all circuit elements are linear and time invariant. The input voltage is $V_{in}(t)=10 \cos(2t + 40^{\circ})$. The output voltage is of the form $V_{out}(t) = A \cos(\omega t + \phi^{\circ})$. If the ratio between the input and output, $| \frac{V_{out}}{V_{in}} | = 0.5$ and the phase difference between the input and output is $20^{\circ}$, what are:
- a. The radian frequency of the output, $\omega$?
- The amplitude of the output, $A$?
- The phase angle of the output, $\phi$?
10.2: Sinusoidal Signals, Complex Exponentials, and Phasors
In this section, we will review properties of sinusoidal functions and complex exponentials. We will also introduce phasor notation, which will significantly simplify the sinusoidal steady-state analysis of systems, and provide terminology which will be used in subsequent sinusoidal steady-state related modules.
Much of the material presented here has been provided previously in Chapter 8; this material is, however, important enough to bear repetition. Likewise, a brief overview of complex arithmetic, which will be essential in using complex exponentials effectively, is provided at the end of this section. Readers who need to review complex arithmetic may find it useful to peruse this overview before reading the material in this section relating to complex exponentials and phasors.
Sinusoidal Signals
The sinusoidal signal shown in Figure 10.5 is represented mathematically by:
$$f(t)=V_P \cos(\omega t) (Eq. 10.2)$$
The amplitude or peak value of the function is $V_P$. $V_P$ is the maximum value achieved by the function; the function itself is bounded by $+ V_P$ and $- V_P$, so that $-V_P \leq f(t) \leq V_P$. The radian frequency or angular frequency of the function is $\omega$; the units of $\omega$ are radians/second. The function is said to be periodic; periodic functions repeat themselves at regular intervals, so that:
$$f(t+nT) = f(t) (Eq. 10.3)$$
Where $n$ is any integer and $T$ is the period of the signal. The sinusoidal waveform shown in Figure 10.5 goes through one complete cycle or period in $T$ seconds. Since the sinusoid of equation (10.2) repeats itself every $2\pi$ radians, the period is related to the radian frequency of the sinusoid by:
$$\omega = \frac{2\pi}{T} (Eq. 10.4)$$
It is common to define the frequency of the sinusoid in terms of the number of cycles of the waveform which occur in one second. In these terms, the frequency $f$ of the function is:
$$f= \frac{1}{T} (Eq. 10.5)$$
The units of $f$ are cycles/second or Hertz (abbreviated Hz). The frequency and radian frequency are related by:
$$f=\frac{\omega}{2\pi} (Eq. 10.6)$$
Or equivalently:
$$\omega = 2 \pi f (Eq. 10.7)$$
Regardless of whether the sinusoid’s rate of oscillation is expressed as frequency or radian frequency, it is important to realize that the argument of the sinusoid in equation (10.2) must be expressed in radians. Thus, equation (10.2) can be expressed in terms of frequency in Hz as:
$$f(t) = \cos(2 \pi ft) (Eq. 10.8)$$
To avoid confusion in our mathematics, we will almost invariably write sinusoidal functions in terms of radian frequency as shown in equation (10.2), although Hz is generally taken as the standard unit for frequency (experimental apparatus, for example, commonly express frequency in Hz).
A more general expression of a sinusoidal signal is:
$$v(t)=V_P \cos(\omega t + \theta) (Eq. 10.9)$$
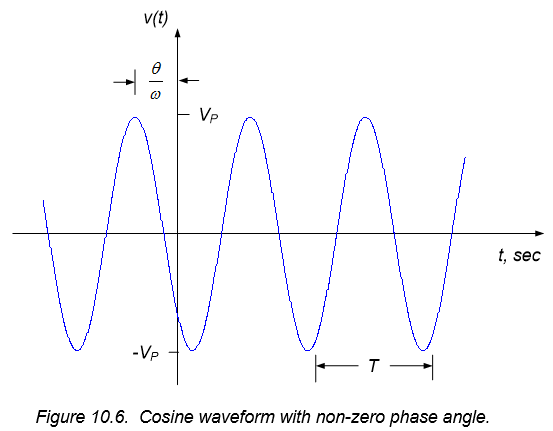
Where $\theta$ is the phase angle or phase of the sinusoid. The phase angle simply translates the sinusoid along the time axis, as shown in Figure 10.6. A positive phase angle shifts the signal left in time, while a negative phase angle shifts the signal right – this is consistent with our discussion of step functions in section 6.1, where it was noted that subtracting a value from the unit step argument resulted a time delay of the function. Thus, as shown in Figure 10.6, a positive phase angle causes the sinusoid to be shifted left by $\frac{\theta}{\omega}$ seconds.
The units of phase angle should be radians, to be consistent with the units of $\omega t$ in the argument of the cosine. It is typical, however, to express phase angle in degrees, with $180^{\circ}$ corresponding to $\pi$ radians. Thus, the conversion between radians and degrees can be expressed as:
Number of degrees $= \frac{180}{\pi} x$ Number of radians
For example, we will consider the two expressions below to be equivalent, though the expression on the right- hand side of the equal sign contains a mathematical inconsistency:
$$V_P \cos(\omega t + \frac{\pi}{2}) = V_P \cos(\omega t + 90^{\circ})$$
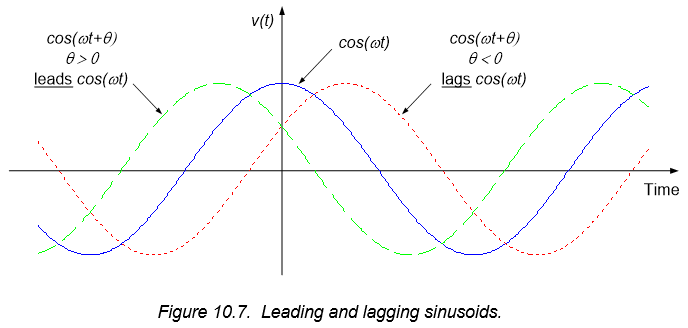
For convenience, we introduce the terms leading and lagging when referring to the sign on the phase angle, $\theta$. A sinusoidal signal $v_1(t)$ is said to lead another sinusoid $v_2(t)$ of the same frequency if the phase difference between the two is such that $v_1(t)$ is shifted left in time relative to $v_2(t)$. Likewise, $v_1(t)$ is said to lag another sinusoid $v_2(t)$ of the same frequency if the phase difference between the two is such that $v_1(t)$ is shifted right in time relative to $v_2(t)$. This terminology is described graphically in Figure 10.7.
Finally, we note that the representation of sinusoidal signals as a phase shifted cosine function, as provided by equation (10.9), is completely general. If we are given a sinusoidal function in terms of a sine function, it can be readily converted to the form of equation (10.9) by subtracting a phase of $\frac{\pi}{2}$ (or $90^{\circ}$) from the argument, since:
$$\sin(\omega t) = \cos(\omega t - \frac{\pi}{2})$$
Likewise, sign changes can be accounted for by a $\pm \pi$ radian phase shift, since:
$$-\cos(\omega t) = \cos(\omega t \pm \pi)$$
Obviously, we could have chosen either a cosine or sine representation of a sinusoidal signal. We prefer the cosine representation, since a cosine is the real part of a complex exponential. In the next module, we will see that sinusoidal steady-state circuit analysis is simplified significantly by using complex exponentials to represent the sinusoidal functions. The cosine is the real part of a complex exponential (as we saw previously in chapter 8). Since all measurable signals are real valued, we take the real part of our complex exponential-based result as our physical response; this results in a solution of the form of equation (10.9).
Since representation of sinusoidal waveforms as complex exponentials will become important to us in circuit analysis, we devote the following subsection to a review of complex exponentials and their interpretation as sinusoidal signals.
Complex Exponentials and Phasors
Euler’s identity can be used to represent complex numbers as complex exponentials:
$$e^{\pm j \theta} = \cos \theta \pm j \sin \theta (Eq. 10.10)$$
If we generalize equation (9) to time-varying signals of arbitrary magnitude we can write:
$$V_Pe^{\pm j (\omega t + \theta)} = V_P \cos(\omega t + \theta) \pm jV_P \sin(\omega t + \theta) (Eq. 10.11)$$
So that:
$$V_P \cos(\omega t + \theta) = Re \left\{ V_Pe^{\pm j(\omega t + \theta)} \right\} (Eq. 10.12)$$
And:
$$V_P \sin(\omega t + \theta) = Im \left\{ V_Pe^{\pm j(\omega t + \theta)} \right\} (Eq. 10.13)$$
Where $Re \left\{ V_Pe^{\pm j(\omega + \theta)} \right\}$ and $Im \left\{ V_Pe^{\pm j(\omega t + \theta)} \right\}$ denote the real part of $V_Pe^{\pm j(\omega t + \theta)}$ and the imaginary part of $V_Pe^{\pm j(\omega t + \theta)}$, respectively.
The complex exponential of equation (10.11) can also be written as:
$$V_Pe^{\pm j(\omega t + \theta)} = V_Pe^{j \theta} e^{j \omega t} (10.14)$$
The term $V_Pe^{j \theta}$ on the right-hand side of equation (10.14) is simply a complex number which provides the magnitude and phase information of the complex exponential of equation (10.11). From equation (10.12), this magnitude and phase can be used to express the magnitude and phase angle of a sinusoidal signal of the form given in equation (10.9).
The complex number in polar coordinates which provides the magnitude and phase angle of a time-varying complex exponential, as given in equation (10.14) is called a phasor. The phasor representing $V_P \cos(\omega t + \theta)$ is defined as:
$$\underline{V} = V_Pe^{j \theta} = V_P \angle \theta (Eq. 10.15)$$
We will use a capital letter with an underscore to denote a phasor. Using bold typeface to represent phasors is more common; our notation is simply for consistency between lecture material and written material – boldface type is difficult to create on a whiteboard during lecture!
Note:
The phasor representing a sinusoid does not provide information about the frequency of the sinusoid – frequency information must be kept track of separately.
Complex Arithmetic Review
Much the material in this section has been provided previously in section 8.3. It is repeated here to emphasize its importance and to expand slightly upon some crucial topics.
In our presentation of complex exponentials, we first provide a brief review of complex numbers. A complex number contains both real and imaginary parts. Thus, we may write a complex number $\underline{A}$ as:
$$\underline{A} a + jb (Eq. 10.16)$$
Where:
$$j= \sqrt{-1} (Eq. 10.17)$$
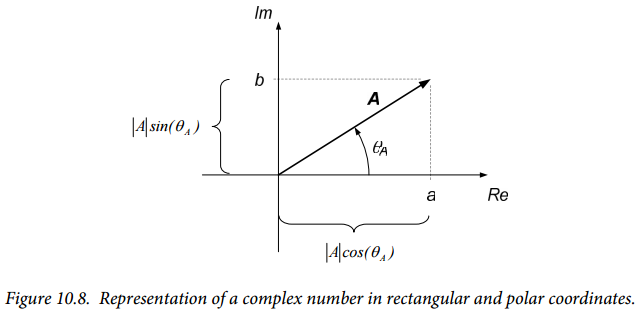
And the underscore denotes a complex number. The complex number $\underline{A}$ can be represented on orthogonal axes representing the real and imaginary part of the number, as shown in Figure 10.8. (In Figure 10.8, we have taken the liberty of representing $\underline{A}$ as a vector, although it is really just a number.) We can also represent the complex number in polar coordinates, also shown in Figure 10.8. The polar coordinates consist of a magnitude $|A|$ and phase angle $\theta A$, defined as:
$$|A| = \sqrt{a^2+b^2} (Eq. 10.18)$$
$$\theta_A = \tan^{-1} \left( \frac{b}{a} \right) (Eq. 10.19)$$
Notice that the phase angle is defined counterclockwise from the positive real axis. Conversely, we can determine the rectangular coordinates from the polar coordinates from:
$$a=Re \left\{ \underline{A} \right\} = |A| \cos(\theta_A) (Eq. 10.20)$$
$$b=Im \left\{ \underline{A} \right\} = |A| \sin(\theta_A) (Eq. 10.21)$$
Where the notation $Re \left\{ \underline{A} \right\}$ and $Im \left\{ \underline{A} \right\}$ denote the real part of $\underline{A}$ and the imaginary part of $\underline{A}$, respectively.
The polar coordinates of a complex number of $\underline{A}$ are often represented in the form:
$$\underline{A} |A| \angle \theta_A (Eq. 10.22)$$
An alternate method of representing complex numbers in polar coordinates employs complex exponential notation. Without proof, we claim that:
$$e^{j \theta} = 1 \angle \theta (Eq. 10.23)$$
Thus, $e^{j \theta}$ is a complex number with magnitude 1 and phase angle $\theta$. From Figure 10.8, it is easy to see that this definition of the complex exponential agrees with Euler’s equation:
$$e^{\pm j \theta} = \cos \theta \pm j \sin \theta (Eq. 10.24)$$
With the definition of equation (10.23), we can define any arbitrary complex number in terms of complex numbers. For example, our previous complex number $\underline{A}$ can be represented as:
$$\underline{A} = |A| e^{j \theta_A} (Eq. 10.25)$$
We can generalize our definition of the complex exponential to time-varying signals. If we define a time varying signal $e^{j \omega t}$, we can use equation (10.24) to write:
$$e^{j \omega t} = \cos \omega t \pm j \sin \omega t (Eq. 10.26)$$
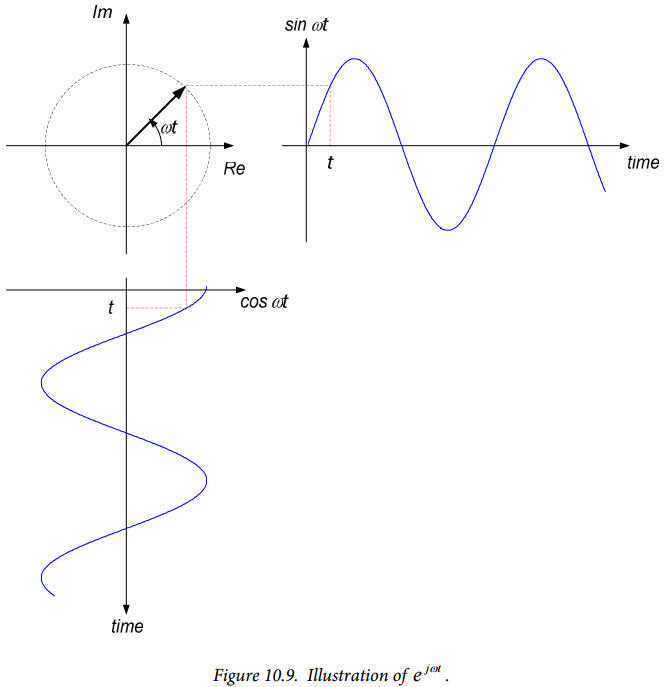
The signal $e^{j \omega t}$ can be visualized as a unit vector rotating around the origin in the complex plane; the tip of the vector scribes a unit circle with its center at the origin of the complex plane. This is illustrated in Figure 10.9. The vector rotates at a rate defined by the quantity $\omega$ – the vector makes one complete revolution every $\frac{2 \pi}{\omega}$ seconds.
The projection of this rotating vector on the real axis traces out the signal $\cos \omega t$, as shown in Figure 10.7, while the projection of the rotating vector on the imaginary axis traces out the signal $\sin \omega t$, also shown in Figure 10.9.
Thus, we interpret the complex exponential function $e^{j \omega t}$ as an alternate “type” of sinusoidal signal. The real part of this function is $\cos \omega t$ while the imaginary part of this function is $\sin \omega t$.
Addition and subtraction of complex numbers is most easily performed in rectangular coordinates. Given two complex numbers $\underline{A}$ and $\underline{B}$, defined as:
$$\underline{A} = a + jb$$
$$\underline{B} = c + jd$$
The sum and difference of the complex number can be determined by:
$$\underline{A} + \underline{B} = (a+c) + j(b+d)$$
And:
$$\underline{A} - \underline{B} = (a-c) + j(b-d)$$
Multiplication and division, on the other hand, are probably most easily performed using polar coordinates. If we define two complex numbers as:
$$\underline{A} = |A| e^{j \theta_A} = |A| \angle \theta_A$$
$$\underline{B} = |B| e^{j \theta_B} = |B| \angle \theta_B$$
The product and quotient can be determined by:
$$\underline{A} \cdot \underline{B} = |A| e^{j \theta_A} \cdot |B| e ^{j \theta_B} = |A| \cdot |B| e^{j(\theta_A + \theta_B)} = |A| \cdot |B| \angle (\theta_A + \theta_B)$$
And:
$$\frac{\underline{A}}{\underline{B}} = \frac{|A|e^{j \theta_A}}{|B|e^{j \theta_B}} = \frac{\underline{A}}{\underline{B}} \angle (\theta_A - \theta_B)$$
The conjugate of a complex number, denoted by a *, is obtained by changing the sign on the imaginary part of the number. For example, if $\underline{A} = a + jb = |A| e^{j \theta}$, then:
$$\underline{A^*} = a-jb= |A|e^{-j \theta}$$
Conjugation does not affect the magnitude of the complex number, but it changes the sign on the phase angle. It is easy to show that:
$$\underline{A} \cdot \underline{A^*} = |A|^2$$
Several useful relationships between polar and rectangular coordinate representations of complex numbers are provided below. The reader is encouraged to prove any that are not self-evident.
$$j=1 \angle 90^{\circ} \\ -j = 1 \angle - 90^{\circ} \\ \frac{1}{j} = -j = 1 \angle - 90^{\circ} \\ 1=1 \angle 0^{\circ} \\ -1=1 \angle 180^{\circ}$$
Section Summary
- Periodic signals repeat themselves at a specific time interval. Sinusoidal signals are a special case of periodic signals.
- A sinusoidal signal can always be written in the form $v(t) = V_P \cos(\omega t + \theta)$.
- It is often convenient, when analyzing a system’s steady-state response to sinusoidal inputs, to express sinusoidal signals in terms of complex exponentials. This is possible because of Euler’s formula:
$$e^{\pm j \omega t} = \cos \omega t \pm j \sin \omega t$$
- From Euler’s formula, a sinusoidal signal can be expressed as the real part of a complex exponential:
$$v(t) = V_P \cos(\omega t + \theta) = Re \left\{ V_Pe^{\pm j(\omega t + \theta)} \right\}$$
- The magnitude and phase angle of a complex exponential signal are conveniently expressed as a phasor:
$$\underline{V} = V_Pe^{j \theta}$$
- Using phasor notation, the above complex exponential signal can be written as:
$$V_Pe^{\pm j(\omega t + \theta)} = \underline{V}e^{j \omega t}$$
- Phasors can then be operated on arithmetically in the same way as any other complex number. However, when operating on phasors, keep in mind that you are dealing with the amplitude and phase angle of a sinusoidal signal.
Exercises
- Express the following complex numbers in rectangular form:
- $3e^{j45^{\circ}}$
- $5\sqrt{2}e^{j135^{\circ}}$
- $2.5e^{j90^{\circ}}$
- $6e^{j \pi}$
- Express the following complex numbers in complex exponential form:
- $2-j2$
- $-j3$
- $6$
- $3+j$
- Evaluate the following expressions. Express your results in complex exponential form.
- $-\frac{j}{2(j+1)}$
- $\frac{2-j2}{4+j4}$
- $2e^{j45^{\circ}} \cdot \frac{2}{j+1}$
- $j+ \frac{2}{j}$
- Represent the following sinusoids in phasor form:
- $3 \cos(5t-60^{\circ})$
- $-2 \cos(300t+45^{\circ})$
- $\sin(6t)$
- $7\cos(3t)$
- Write the signal representing the real part of the following complex exponentials:
- $5\sqrt{2}e^{j(100t-45^{\circ})}$
- $3e^{j \pi}e^{j3t}$
- $2e^{j(\pi t-30^{\circ})}+4e^{j(4t+20^{\circ})}$
10.3: Sinusoidal Steady-state System Response
In this section, the concepts presented in sections 10.1 and 10.2 are used to determine the sinusoidal steady-state response of electrical circuits. We will develop sinusoidal steady-state circuit analysis in terms of examples, rather than attempting to develop a generalized approach à priori. The approach is straightforward, so that a general analysis approach can be inferred from the application of the method to several simple circuits.
The overall approach to introducing sinusoidal steady-state analysis techniques used in this section is as follow:
- We first determine the sinusoidal steady-state response of a simple RC circuit, by solving the differential equation governing the system. This results directly in a solution which is a function of time; it is a time domain analysis technique. The approach is mathematically tedious, even for the simple circuit being analyzed.
- We then re-analyze the same RC circuit using complex exponentials and phasors. This approach results in the transformation of the governing time domain differential equation into an algebraic equation which is a function of frequency. It is said to describe the circuit behavior in the frequency domain. The frequency domain equation governing the system is then solved using phasor techniques and the result transformed back to the time domain. This approach tends to be mathematically simpler than the direct solution of the differential equation in the time domain, though in later sections we will simplify the approach even further.
- Several other examples of sinusoidal steady-state circuit analysis are then performed using frequency domain techniques in order to demonstrate application of the approach to more complex circuits. It will be seen that, unlike time-domain analysis, the difficulty of the frequency domain analysis does not increase drastically as the circuit being analyzed becomes more complex.
Example 10.2: RC Circuit Sinusoidal Steady-state Response via Time-domain Analysis
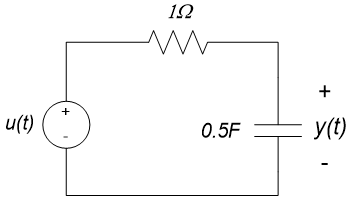
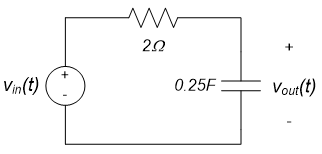
In the circuit below, the input voltage is $u(t) = V_P \cos(\omega t)$ volts and the circuit response (or output) is the capacitor voltage, $y(t)$. We want to find the steady-state response (as $t \rightarrow \infty$).
The differential equation governing the circuit is:
$$\frac{dy(t)}{dt} + \frac{1}{RC} y(t) = \frac{V+P}{RC \cos(\omega t)} (Eq. 10.27)$$
Since we are concerned only with the steady-state response, there is no need to determine the homogeneous solution of the differential equation (or, equivalently, the natural response of the system) so we will not be concerned with the initial conditions on the system – their effect will have died out by the time we are interested in the response. Thus, we only need to determine the particular solution of the above differential equation (the forced response of the system). Since the input function is a sinusoid, the forced response must be sinusoidal, so we assume that the forced response $y_f(t)$ has the form:
$$y_f(t) = A \cos(\omega t) + B \sin(\omega t) (eq. 10.28)$$
Substituting equation (10.28) into equation (10.27) results in:
$$-A \omega \sin(\omega t) + B \omega \cos(\omega t) + \frac{1}{RC} \left[ \cos(\omega t) + B \sin(\omega t) \right] = \frac{V_P}{RC} \cos(\omega t) (Eq. 10.29)$$
Equating coefficients on the sine and cosine terms results in two equations in two unknowns:
$$-A \omega + \frac{B}{RC} = 0 \\ B \omega + \frac{A}{RC} = \frac{V_P}{RC} \\ (Eq. 10.30)$$
Solving equations (10.30) results in:
$$A = \frac{V_P}{1+(\omega RC)^2} \\ B = \frac{V_P \omega RC}{1+(\omega RC)^2} \\ (Eq. 10.31)$$
Substituting equations (10.31) into equation (10.28) and using the trigonometric identity $A \cos(\omega t) + B \sin(\omega t) = \sqrt{A^2+B^2} \cos \left[ \omega t - \tan^{-1} \left( \frac{B}{A} \right) \right]$ results in (after some fairly tedious algebra):
$$y_f(t) = \frac{V_P}{\sqrt{1+(\omega RC)^2}} \cos \left[ \omega t - \tan^{-1} (\omega RC) \right] (Eq. 10.32)$$
Note:
In all steps of the above analysis, the functions being used are functions of time. That is, for a particular value of $\omega$, the functions vary with time. The above analysis is being performed in the time domain.
Example 10.3: RC Circuit Sinusoidal Steady-state Response via Frequency-domain Analysis
We now repeat Example 10.2, using phasor-based analysis techniques. The circuit being analyzed is shown in the figure to the left below for reference; the input voltage is $u(t)=V_P \cos(\omega t)$ volts and the circuit response (or output) is the capacitor voltage, $y(t)$. We still want to find the steady-state response (as $t \rightarrow \infty$). In this example, we replace the physical input, $u(t)=V_P \cos(\omega t)$, with a conceptual input based on a complex exponential as shown in the figure to the right below. The complex exponential input is chosen such that the real part of the complex input is equivalent to the physical input applied to the circuit. We will analyze the conceptual circuit with the complex valued input.
The differential equation governing the circuit above is the same as in example 10.2, but with the complex input:
$$\frac{dy(t)}{dt} + \frac{1}{RC} y(t) = \frac{V_P}{RC} e^{j \omega t} (Eq. 10.33)$$
As in example 10.2, we now assume a form of the forced response. In this case, however, our solution will be assumed to be a complex exponential:
$$y(t)=|Y|e^{j(\omega t + \theta)} (Eq. 10.34)$$
Which can be written in phasor form as:
$$y(t)= \underline{Y} e^{j \omega t} (Eq. 10.35)$$
Where the phasor $\underline{Y}$ is a complex number which can be expressed in either exponential or polar form:
$$\underline{Y}=|Y|e^{j \theta_Y}=|Y| \angle \theta_Y (Eq. 10.36)$$
Substituting (10.35) into equation (10.33) and taking the appropriate derivative results in:
$$j \omega \underline{Y}e^{j \omega t} + \frac{1}{RC} \underline{Y}e^{j \omega t} = \frac{V_P}{RC}e^{j \omega t} (Eq. 10.37)$$
We can divide equation (10.37) by $e^{j \omega t}$ to obtain:
$$j \omega \underline{Y} + \frac{1}{RC} \underline{Y} = \frac{V_P}{RC} (Eq. 10.38)$$
Equation (10.38) can be solved for $\underline{Y}$:
$$\left( j \omega + \frac{1}{RC} \right) \underline{Y} = \frac{V_P}{RC} \Rightarrow \underline{Y} = \frac{\frac{V_P}{RC}}{j \omega + \frac{1}{RC}} (Eq. 10.39)$$
So that:
$$\underline{Y}=\frac{V_P}{1+j \omega RC} (Eq. 10.40)$$
The magnitude and phase of the output response can be determined from the phasor $\underline{Y}$:
$$|Y|=\frac{V_P}{\sqrt{1+(\omega RC)^2}} \\ \angle_Y = - \tan^{-1}(\omega RC) \\ (Eq. 10.41)$$
The complex exponential form of the system response is then, from equation (10.35):
$$y(t) = \frac{V_P}{\sqrt{1+(\omega RC)^2}}e^{j(\omega t -\tan^{-1}(\omega RC))} (Eq. 10.42)$$
Since our physical input is the real part of the conceptual input, and since all circuit parameters are real valued, our physical output is the real part of equation (10.42) and the forced response is:
$$y_f(t)=\frac{V_P}{\sqrt{1+(\omega RC)^2}} \cos \left[ \omega t - \tan^{-1} (\omega RC) \right] (Eq. 10.43)$$
Which agrees with our result from the time-domain analysis of example 10.2.
Notes:
- The transition from equation (10.37) to equation (10.38) removed the time-dependence of our solution. The solution is now no longer a function of time! The solution includes the phasor representations of the input and output, as well as (generally) frequency. Thus, equation (10.38) is said to be in the phasor domain or, somewhat more commonly, the frequency domain. The analysis remains in the frequency domain until we reintroduce time in equation (10.43).
- Equations in the frequency domain are algebraic equations rather than differential equations. This is a significant advantage mathematically, especially for higher-order systems.
- Circuit components must have purely real values for the above process to work. We do not prove this, but merely make the claim that the process of taking the real part of the complex exponential form of the system response is not valid if circuit components (or any coefficients in the differential equation governing the system) are complex valued. Fortunately, this is not a strong restriction – complex values do not exist in the physical world.
- The complex exponential we use for our “conceptual” input, $V_P e^{j \omega t}$, is not physically realizable. That is, we cannot create this signal in the real world. It is a purely mathematical entity which we introduce solely for the purpose of simplifying the analysis. The complex form of the output response given by equation (10.42) is likewise not physically realizable.
Example 10.4: Numerical Example and Phasor Diagrams
We now examine the circuit shown below. This circuit is simply the circuit of Example 10.3, with $R = 1 k\Omega$, $C = 1 \mu F$, $V_P = 5 V$, and $\omega = 1000$ rad/second.
In phasor form, the input is $u(t) = \underline{U}e^{j1000t}$, so that the phasor $\underline{U}$ is $\underline{U}=5e^{j0^{\circ}} = 5 \angle 0^{\circ}.$
The phasor form of the output is given by equations (10.41):
$$|Y|= \frac{V_P}{\sqrt{1+(\omega RC)^2}} = \frac{5}{\sqrt{1+(1000 \cdot 1000 \cdot 1 x 10^{-6})}} = \frac{5}{\sqrt{2}} \\ \angle \theta_T = -\tan^{-1} (\omega RC) = -\tan^{-1} (1000 \cdot 1000 \cdot 1x10^{-6}) = - \frac{\pi}{4} = -45^{\circ}$$
And the phasor $\underline{Y}$ can be written as $\underline{Y} = \frac{5}{\sqrt{2}}e^{-j45^{\circ}}=\frac{5}{\sqrt{2}} \angle - 45^{\circ}$
We can create a phasor diagram of the input phasor $\underline{U}$ and the output phasor $\underline{Y}$
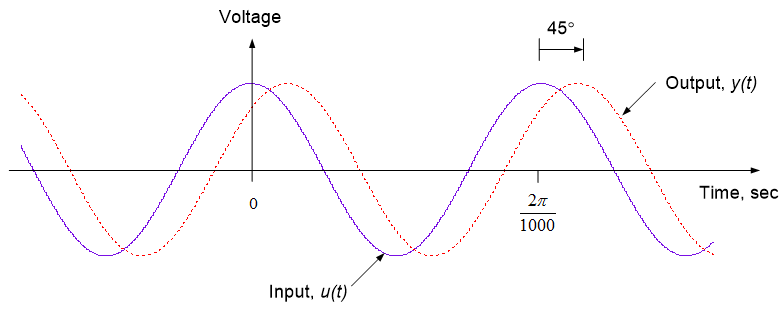
The phasor diagram shows the input and output phasors in the complex plane. The magnitudes of the phasors are typically labeled on the diagram, as is the phase difference between the two phasors. Note that since the phase difference between $\underline{Y}$ and $\underline{U}$ is negative, the output $y(t)$ lags the input $u(t)$.
The time-domain form of the output is:
$$y(t)= \frac{5}{\sqrt{2}} \cos(1000t-45^{\circ})$$
A time-domain plot of the input and output are shown below. This plot emphasizes that the output lags the input, as indicated by our phasor diagram. The plot below replicates what would be seen from a measurement of the input and output voltages.
Example 10.5: RL Circuit Sinusoidal Steady-state Response
In the circuit to the left below, the input voltage is $V_P \cos(\omega t + 30^{\circ})$ volta and the circuit response (or output) is the inductor current, $i_L(t)$. We want to find the steady-state response $i_L(t \rightarrow \infty)$.
The differential equation governing the circuit can be determined by applying KVL around the single loop:
$$L \frac{di_L(t)}{dt}+Ri_L(t)=u(t) (Eq. 10.44)$$
We apply the conceptual input, $u(t)=V_Pe^{j(\omega t+30^{\circ})}$ as shown in the figure to the right above to this equation. We can represent this input in phasor form as:
$$u(t)=\underline{U}e^{j \omega t} (Eq. 10.45)$$
Where the phasor $\underline{U}=V_P \angle 30^{\circ}$. Likewise, we represent the output in phasor form:
$$i_L(t)= I_{\underline{L}}e^{j \omega t} (Eq. 10.46)$$
Where the phasor $I_{\underline{L}}=|I_L| \angle \theta$.
Substituting our assumed input and output in phasor form into equation (10.44) results in:
$$Lj \omega I_{\underline{L}}e^{j \omega t} + RI_{\underline{L}}e^{j \omega t} = \underline{U}e^{j \omega t} (Eq. 10.47)$$
As in Example 10.4, we divide through by $e^{j \omega t}$ to obtain the frequency domain governing equation:
$$Lj \omega I_{\underline{L}} + RI_{\underline{L}}=\underline{U} (Eq. 10.48)$$
So that:
$$I_{\underline{L}}= \frac{\underline{U}}{R+j \omega L} = \frac{V_P \angle 30^{\circ}}{R+ j \omega L} (Eq. 10.49)$$
So that the phasor $I_{\underline{L}}$ has magnitude and phase:
$$|I_L|= \frac{V_P}{\sqrt{R^2+(\omega L)^2}} \\ \theta = 30^{\circ} -\tan^{-1} \left( \frac{\omega L}{R} \right) \\ (Eq. 10.50)$$
The exponential form of the inductor current is therefore:
$$i_L(t)=\frac{V_P}{\sqrt{R^2+(\omega L)^2}} e^{j \left[ \omega t + 30^{\circ}-\tan^{-1} \left( \frac{\omega L}{R} \right) \right]} (Eq. 10.51)$$
And the actual physical inductor current is:
$$i_L(t)=\frac{V_P}{\sqrt{R^2+(\omega L)^2}} \cos \left[ \omega t + 30^{\circ} -\tan^{-1} \left( \frac{\omega L}{R} \right) \right] (Eq. 10.52)$$
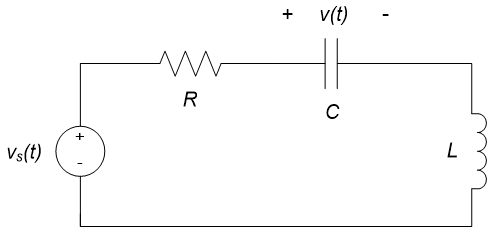
Example 10.6: Series RLC Circuit Sinusoidal Steady-state Response
Consider the circuit shown below. The input to the circuit is $v_S(t)=3 \cos(\omega t)$ volts. Find the output $v(t)$.
In section 8.1, it was determined that the differential equation governing the system is:
$$\frac{d^2v(t)}{dt^2} + \frac{R}{L} \frac{dv(t)}{dt} + \frac{1}{LC} v(t) = \frac{1}{LC} v_S(t) (Eq. 10.53)$$
Assuming that the input is a complex exponential whose real part is the given $v_S(t)$ provides:
$$v_S(t)=2e^{j \omega t} (Eq. 10.54)$$
The output is assumed to have the phasor form:
$$v(t) = \underline{V}e^{j \omega t} (Eq. 10.55)$$
where $\underline{V}$ contains the (unknown) magnitude and phase of the output voltage. Substituting equations (10.54) and (10.55) into equation (10.53) results in:
$$-(j \omega)^2 \underline{V}e^{j \omega t} + \frac{R}{L} (j \omega) \underline{V}e^{j \omega t} + \frac{1}{LC} \underline{V}e^{j \omega t} = \frac{1}{LC} 2e^{j \omega t} (Eq. 10.56)$$
Dividing through by $e^{j \omega t}$ and noting that $j^2=-1$, results in:
$$\left[ \frac{1}{LC} - \omega^2 + j \frac{R}{L} \omega \right] \underline{V} = \frac{2}{LC}$$
So that:
$$\underline{V} = \frac{\frac{2}{LC}}{\frac{1}{LC} - \omega^2 + j \frac{R}{L} \omega} (Eq. 10.57)$$
The magnitude and phase of $\underline{V}$ are:
$$|V|=\frac{\frac{2}{LC}}{\sqrt{ \left( \frac{1}{LC} - \omega^2 \right) ^2 + \left( \frac{R}{L} \omega \right) ^2}}$$
$$\angle \underline{V} = -\tan^{-1} \left( \frac{\frac{R \omega}{L}}{\frac{1}{LC}-\omega^2} \right)$$
And the capacitor voltage is:
$$v(t)= \frac{\frac{2}{LC}}{\sqrt{ \left( \frac{1}{LC} - \omega^2 \right) + \left( \frac{R}{L} \omega \right) ^2}} \cos \left\{ \omega t - \tan^{-1} \left( \frac{\frac{R \omega}{L}}{\frac{1}{LC} - \omega^2} \right) \right\} (Eq. 10.58)$$
The complex arithmetic in this case becomes a bit tedious, but the complexity of the frequency-domain approach is nowhere near that of the time-domain solution of the second-order differential equation.
Section Summary
- The steady-state response of a linear time invariant system to a sinusoidal input is a sinusoid with the same frequency as the input sinusoid. Only the amplitude and phase angle of the output sinusoid can be different from the input sinusoid, so the solution is entirely characterized by the magnitude and phase angle of the output sinusoid.
- The steady-state response of a system to a sinusoidal input can be determined by assuming a form of the solution, substituting the input signal and the output signal into the governing differential equation and solving for the amplitude and phase angle of the output sinusoid.
- The solution approach is simplified if the sinusoidal signals are represented as complex exponentials. The approach is further simplified if these complex exponentials are represented in phasor form – the phasor is a complex number which provides the amplitude and phase angle of the complex exponential.
- The above solution approaches convert the governing differential equation into an algebraic equation. If complex exponentials in phasor form are used to represent the signals of interest, the governing algebraic equation can have complex coefficients.
- The relationships between the steady state sinusoidal inputs and outputs are described by a relationship between the amplitudes (generally a ratio between the output amplitude and the input amplitude) and the phase angles (generally a difference between the output and input phase angles).
- These relationships are often displayed graphically in a phasor diagram.
Exercises
1. The differential equation governing a circuit is:
$$2\frac{dy(t)}{dt}+ 6y(t)=u(t)$$
Where $u(t)$ is the input and $y(t)$ is the output. Determine the steady-state response of the circuit to an input $u(t)=2 \cos(3t)$.
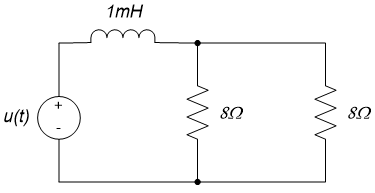
2. For the circuit shown below, $u(t)$ is the input and $y(t)$ is the output.
- Write the differential equation relating $u(t)$ and $y(t)$.
- Determine $y(t)$, $t \rightarrow \infty$, if $u(t)=3 \cos(2t)$.
10.4: Phasor Representations of Circuit Elements
In section 10.3, we determined the sinusoidal steady-state response of an electrical circuit by transforming the circuit’s governing differential equation into the frequency domain or phasor domain. This transformation converted the differential equation into an algebraic equation. This conversion significantly simplified the subsequent circuit analysis, at the relatively minor expense of performing some complex arithmetic. In this module, we will further simplify this analysis by transforming the circuit itself directly into the frequency domain and writing the governing algebraic equations directly.
This approach eliminates the necessity of ever writing the differential equation governing the circuit (as long as we are only interested in the circuit’s sinusoidal steady-state response). This approach also allows us to apply analysis techniques previously used only for purely resistive circuits to circuits containing energy storage elements.
Phasor Domain Voltage-current Relationships
In section 10.2, we introduced phasors as a method for representing sinusoidal signals. Phasors provide the magnitude and phase of the sinusoid. For example, the signal $v(t)=V_P \cos(\omega t + \theta)$ has amplitude $V_P$ and phase angle $\theta$. This information can be represented in phasor form as:
$$\underline{V}=V_Pe^{j \theta}$$
In which complex exponentials are used to represent the phase. Equivalently, the phase can be represented as an angle, and the phasor form of the signal can be written as:
$$\underline{V} = V_P \angle \theta$$
Note that the phasor does not provide the frequency of the signal, $\omega$. To include frequency information, the signal is typically written in complex exponential form as:
$$v(t)= \underline{V}e^{j \omega t}$$
In section 10.3, we used phasor representations to determine the steady-state sinusoidal response of electrical circuits by representing the signals of interest as complex exponentials in phasor form. When signals in the governing differential equation are represented in this form, the differential equation becomes an algebraic equation, resulting in a significant mathematical simplification. In section 10.3, it was also noted that the mathematics could be simplified further by representing the circuit itself directly in the phasor domain. In this section, we present the phasor form of voltage-current relations for our basic circuit elements: resistors, inductors, and capacitors. The voltage-current relations for these elements are presented individually in the following sub- sections.
Resistors
The voltage-current relationship for resistors is provided by Ohm’s Law:
$$v(t) = R \cdot i(t) (Eq. 10.59)$$
If the voltage and current are represented in phasor form as:
$$v(t)= \underline{V}e^{j \omega t} (Eq. 10.60)$$
And:
$$i(t)= \underline(I)e^{j \omega t} (Eq. 10.61)$$
Equation (10.59) can be written:
$$\underline{V}e^{j \omega t} = R \cdot \underline{I}e^{j \omega t} (Eq. 10.62)$$
Cancelling the $e^{j \omega t}$ term from both sides results in:
$$\underline{V}= R \cdot \underline{I} (Eq. 10.63)$$
The voltage-current relationship for resistors (Ohm’s Law) is thus identical in the time and frequency domains. Schematically, the time- and frequency-domain representations of a resistor are as shown in Figure 10.10.
Equation (10.63) shows that, in the frequency domain, the voltage and current in a resistor are related by a purely real, constant multiplicative factor. Thus, the sinusoidal voltage and current for a resistor are simply scaled versions of one another – there is no phase difference in the voltage and current for a resistor. This is shown graphically in Figure 10.11.
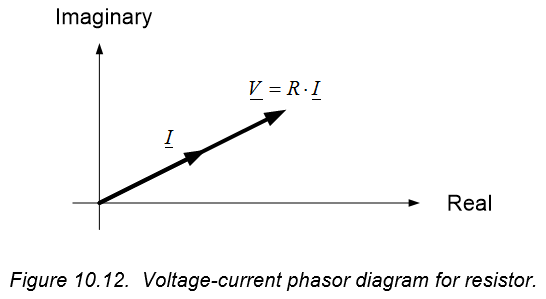
A representative phasor diagram of the resistor’s voltage and current will appear as shown in Figure 10.12 – the phasors representing voltage and current will always be in the same direction, though their lengths will typically be different.
Inductors
The voltage-current relationship for inductors is:
$$v(t)= L \cdot \frac{di(t)}{dt} (Eq. 10.64)$$
As with the resistive case presented above, we assume that the voltage and current are represented in phasor form as $v(t)=\underline{V}e^{j \omega t}$ and $i(t)=\underline{I}e^{j \omega t}$, respectively. Substituting these expressions into equation (10.64) results in:
$$\underline{V}e^{j \omega t} = L \cdot \frac{d}{dt} \left[ \underline{I}e^{j \omega t} \right] = L (j \omega) \underline{I}e^{j \omega t} (Eq. 10.65)$$
Dividing equation (10.65) by $e^{j \omega t}$ and re-arranging terms slightly results in the phasor domain or frequency domain representation of the inductor’s voltage-current relationship:
$$\underline{V} = j \omega L \cdot \underline{I} (Eq. 10.66)$$
In the frequency domain, therefore, the inductor’s phasor voltage is proportional to its phasor current. The constant of proportionality is, unlike the case of the resistor, an imaginary number and is a function of the frequency, $\omega$. It is important to note that the differential relationship of equation (10.64) has been replaced with an algebraic voltage-current relationship. Schematically, the time- and frequency-domain representations of an inductor are as shown in Figure 10.13.
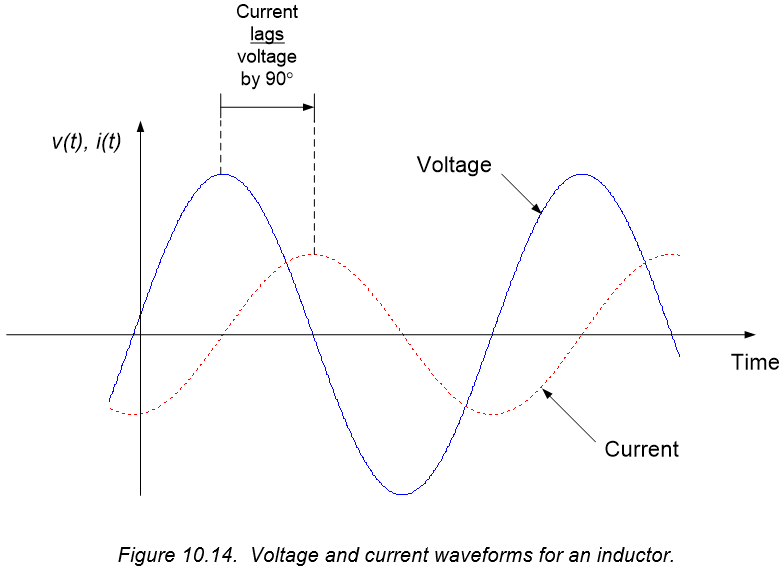
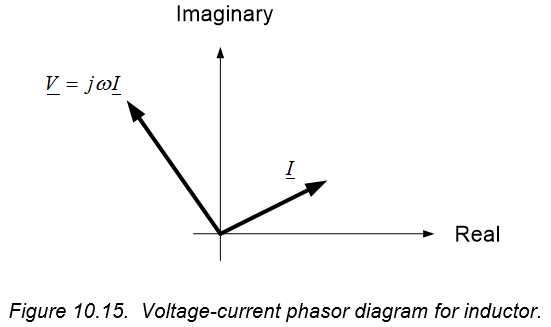
The factor of j in the voltage-current relationship of equation (10.66) introduces a $90^{\circ}$ phase shift between inductor voltage and current. Since $j=e^{j90^{\circ}}$, the voltage across an inductor leads the current by $90^{\circ}$ (or, equivalently, the current lags the voltage by $90^{\circ}$). The relative phase difference between inductor voltage and current are shown graphically in the time domain in Figure 10.14. A representative phasor diagram of the inductor’s voltage and current will appear as shown in Figure 10.15 – the voltage phasor will always lead the current phasor by $90^{\circ}$, and the length of the voltage phasor will be a factor of $\omega L$ times the length of the current phasor.
Capacitors
The voltage-current relationship for capacitors is:
$$i(t)=C \cdot \frac{dv(t)}{dt} (Eq. 10.67)$$
As with the previous cases, we assume that the voltage and current are represented in phasor form as $v(t)=\underline{V}e^{j \omega t}$ and $i(t)=\underline{I}e^{j \omega t}$, respectively. Substituting these expressions into equation (10.67) results in:
$$\underline{I}e^{j \omega t} = C \cdot \frac{d}{dt} \left[ \underline{V}e^{j \omega t} \right] = C(j \omega) \underline{V} e^{j \omega t} (Eq. 10.68)$$
Dividing the above by $e^{j \omega t}$ results in the phasor domain or frequency domain representation of the capacitor's voltage-current relationship:
$$\underline{I}=j \omega C \cdot \underline{V} (Eq. 10.69)$$
To be consistent with our voltage-current relationship for resistors and capacitors, we write the voltage in terms of the current. Thus,
$$\underline{V} = \frac{1}{j \omega C} \cdot \underline{I} (Eq. 10.70)$$
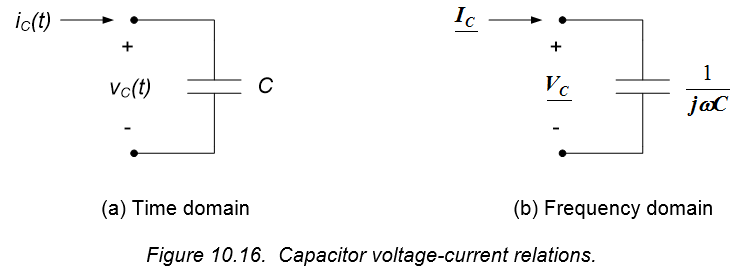
In the frequency domain, therefore, the capacitor’s phasor voltage is proportional to its phasor current. The constant of proportionality is an imaginary number and is a function of the frequency, $\omega$. As with inductors, the differential voltage-current relationship has been replaced with an algebraic relationship. Schematically, the time- and frequency-domain representations of a capacitor are as shown in Figure 10.16.
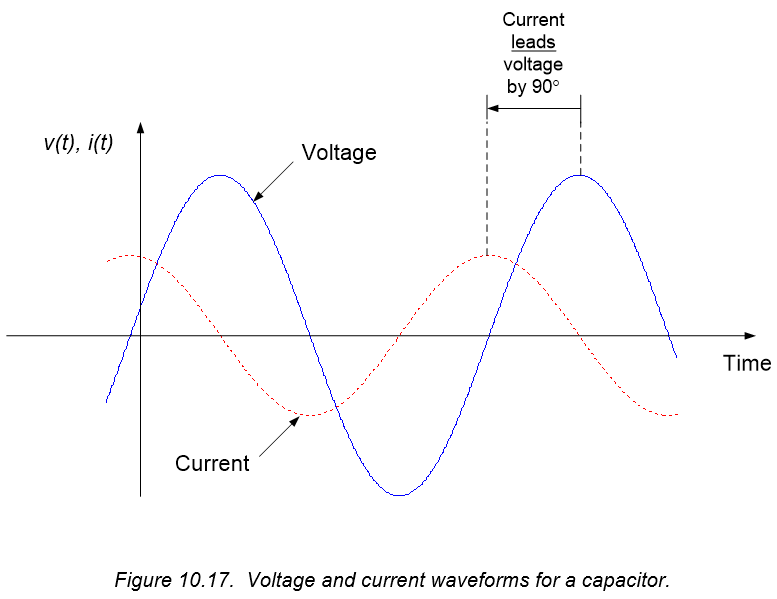
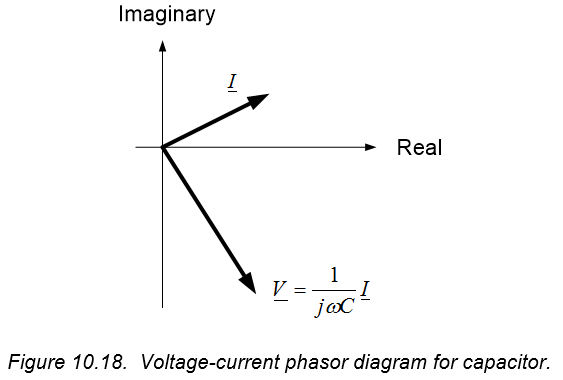
The factor of $\frac{1}{j}$ in the voltage-current relationship of equation (10.70) introduces a $90^{\circ}$ phase shift between inductor voltage and current. Since $\frac{1}{j}=e^{-j90^{\circ}} = 1 \angle - 90^{\circ}$, the voltage across a capacitor lags the current by $90^{\circ}$ (or, equivalently, the current leads the voltage by $90^{\circ}$). The relative phase difference between capacitor voltage and current are shown graphically in the time domain in Figure 10.17. A representative phasor diagram of the capacitor’s voltage and current will appear as shown in Figure 10.18 – the voltage phasor will always lag the current phasor by $90^{\circ}$, and the length of the voltage phasor will be a factor of $\frac{1}{\omega C}$ times the length of the current phasor.
Impedance and Admittance
The frequency domain voltage-current characteristics presented in the previous subsections indicate that the voltage difference across a circuit element can be written in terms of a multiplicative factor (which can be a complex number) times the current through the element. In order to generalize and formalize this concept, we define impedance as the ratio of phasor voltage to phasor current. Impedance is typically denoted as $\underline{Z}$ and is defined mathematically as:
$$\underline{Z} = \frac{\underline{V}}{\underline{I}} (Eq. 10.71)$$
Therefore, if the phasor voltage and current for a circuit element are given by:
$$\underline{V}=V_Pe^{j \theta}$$
And:
$$\underline{I}=I_Pe^{j \phi}$$
Then the impedance is:
$$\underline{Z} = \frac{\underline{V}}{\underline{I}} = \frac{V_P}{I_P}e^{j(\theta_Z)} (Eq. 10.72)$$
Or alternatively,
$$\underline{Z} \frac{V_P}{I_P} \angle \theta_Z (Eq. 10.73)$$
Where $\theta_Z$ is the angle of $\underline{Z}$. The magnitude of the impedance is the ratio of the magnitude of the voltage to the magnitude of the current:
$$|\underline{Z}|=\frac{V_P}{I_P}=\frac{|\underline{V}|}{|\underline{I}|} (Eq. 10.74)$$
And the angle of the impedance is the difference between the voltage phase angle and the current phase angle:
$$\theta_Z= \angle \underline{Z} = \angle \underline{V} - \angle \underline{I} = \theta - \phi (Eq. 10.75)$$
The impedance can also be represented in rectangular coordinates as:
$$\underline{Z} = R + jX (Eq. 10.76)$$
Where $R$ is the real part of the impedance (called the resistance or the resistive component of the impedance) and $X$ is the imaginary part of the impedance (called the reactance or the reactive part of the impedance). $R$ and $X$ are related to $|\underline{Z}|$ and $\angle \underline{Z}$ by the usual rules relating rectangular and polar coordinates, so that:
$$|\underline{Z}|= \sqrt{R^2+X^2} \\ \angle \underline{Z} = \tan^{-1} \left( \frac{X}{R} \right)$$
And:
$$R=Re \left\{ \underline{Z} \right\} = | \underline{Z} | \cos \theta_Z$$
$$X=Im \left\{ \underline{Z} \right\} = | \underline{Z} | \sin \theta_Z$$
Impedance is an extremely useful concept, in that it can be used to represent the voltage-current relations for any two-terminal electrical circuit element in the frequency domain, as indicated in Figure 10.19.
The admittance, $\underline{Y}$, is defined as the reciprocal of impedance:
$$\underline{Y}=\frac{1}{\underline{Z}} (Eq. 10.77)$$
Admittance is also a complex number, and is written in rectangular coordinates as:
$$\underline{Y}=G+jB (Eq. 10.78)$$
Where $G$ is called the conductance and $B$ is the susceptance.
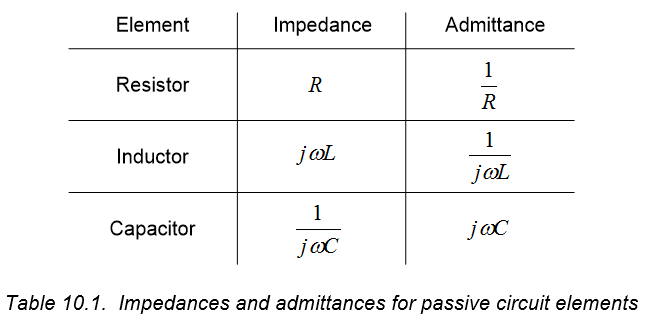
Impedances and admittances for the three electrical circuit elements presented previously in this section are provided in Table 10.1 below. These results are readily obtained from the previously presented phasor domain voltage-current relationships and the definitions of impedance and admittance. The relations provided in Table 10.1 should be committed to memory.
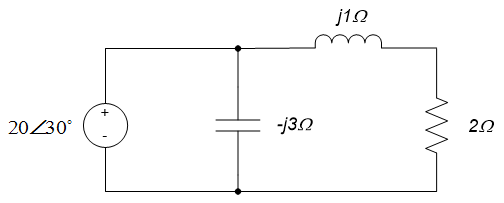
Example 10.7: Provide the Phasor-domain Representation of the Circuit Below
The input amplitude is 20 volts, and the input phase is $30^{\circ}$, so the phasor representation of the input voltage is $20 \angle 30^{\circ}$.
The frequency of the input voltage is $\omega = 10 rad/sec$. Thus, the impedances of the passive circuit elements are as follows:
- Resistor: $\underline{Z} = R = 2 \Omega$
- Inductor: $\underline{Z} = j \omega L = j(10rad / sec)(0.1H) = j 1 \Omega$
- Capacitor: $\underline{Z} = \frac{1}{j \omega C} = \frac{1}{j(10rad / sec) (\frac{1}{30}F)} = \frac{3}{j} \Omega = -j 3 \Omega$
The phasor-domain circuit is shown below.
Section Summary
- Voltage-current relation for our passive circuit elements in the frequency domain are:
- Resistor: $\underline{V}=R\underline{I}$
- Inductor: $\underline{V}=j \omega L \cdot \underline{I}$
- Capacitor: $\underline{V} = \frac{1}{j \omega C} \cdot \underline{I}$
- The impedance of a circuit element is the ratio of the phasor voltage to the phasor current in that element:
- Resistor: $\underline{Z}=R$
- Inductor: $\underline{Z}=j \omega L$
- Capacitor: $\underline{Z} = \frac{1}{j \omega C}$
- Impedance is, in general, a complex number. Units of impedance are ohms ($\Omega$). The real part of impedance is the resistance. The imaginary part of impedance is reactance. Impedance, for general circuit elements, plays the same role as resistance does for resistive circuit elements. In fact, for purely resistive circuit elements, impedance is simply the resistance of the element.
- Admittance is the inverse of impedance.
- Admittance is, in general, a complex number. The real part of admittance is conductance. The imaginary part of admittance is susceptance. For purely resistive circuits, admittance is the same as conductance.
- Impedance and admittance are, in general, functions of frequency.
- Impedance and admittance are not phasors. They are complex numbers – there is no sinusoidal time domain function corresponding to impedance or admittance. (Phasors, by definition, are a way to describe a time- domain sinusoidal function.)
Exercises
1. For the circuit shown below, $u(t)$ is the input and $y(t)$ is the output. Determine $y(t)$, $t \rightarrow \infty$, if $u(t) = 3 \cos(2t)$.
2. Sketch a diagram of the input and output phasors for exercise 1 above.
3. Determine the impedance of the circuit elements shown below if $V_{in}(t) = 2 \cos(4t)$.
4. Determine the impedance of the circuit elements in exercise 3 if $V_{in}(t) = 3 \cos(8t)$.
10.5: Direct Frequency Domain Circuit Analysis
In section 10.3, we determined the steady-state response of electrical circuits to sinusoidal signals using phasor representations of the signals involved, and time-domain representations of the circuit element voltage-current relations. Applying KVL and KCL in this manner resulted in governing equations in which the time dependence had been removed, which converted the governing equations from differential equations to algebraic equations. Unknowns in the resulting algebraic equations were the phasor representations of the signals. These equations could then be solved to determine the desired signals in phasor form; these results could then be used to determine the time-domain representations of the signals.
In section 10.4, we replaced the time-domain voltage-current relations for passive electrical circuit elements with impedances, which provide voltage-current relations for the circuit elements directly in the frequency domain. At the end of section 10.4, we used these impedances to schematically represent a circuit directly in the frequency domain.
In this section, we will use this frequency-domain circuit representation to perform circuit analysis directly in the frequency domain using phasor representations of the signals and impedance representations of the circuit elements. This will allow us to write the algebraic equations governing the phasor representation of the circuit directly, without any reference to the time domain behavior of the circuit. As in section 10.3, these equations can be solved to determine the behavior of the circuit in terms of phasors, and the results transformed to the time domain.
Performing the circuit analysis directly in the frequency domain using impedances to represent the circuit elements can result in a significant simplification of the analysis. In addition, many circuit analysis techniques which were previously applied to resistive circuits (e.g. circuit reduction, nodal analysis, mesh analysis, superposition, Thevenin’s and Norton’s Theorems) are directly applicable in the frequency domain. Since these analysis techniques have been presented earlier for resistive circuits, in this section we will simply:
- Provide examples of applying these analysis methods to frequency-domain circuits, and
- Note any generalizations relative to using phasors in these analysis methods
Throughout this section, the reader should firmly keep in mind that we are dealing only with the steady-state responses of circuits to sinusoidal forcing functions. It is sometimes easy to lose track of this fact, since the sinusoidal nature of the signal is often not explicitly stated, but any time we deal with impedances and phasors, we are working with sinusoidal signals.
Kirchhoff’s Voltage Law
Kirchhoff’s Voltage Law states that the sum of the voltage differences around any closed loop is zero. Therefore, if $v_1(t),v_2(t),\dots, v_N(t)$ are the voltages around some closed loop, KVL provides:
$$\sum_{k=1}^{N} v_k(t)=0 (Eq. 10.79)$$
Substituting the phasor representation of the voltages results in:
$$\sum_{k=1}^{N} \underline{V}_k e^{j \omega t}=0 (Eq. 10.80)$$
Dividing equation (10.80) by $e^{j \omega t}$ results in:
$$\sum_{k=1}^{N} \underline{V}_k = 0 (Eq. 10.81)$$
So that KVL states that the sum of the phasor voltages around any closed loop is zero.
Kirchhoff's Current Law
Kirchhoff's Current Law states that the sum of the currents entering any node is zero. Therefore, if $i_1(t),i_2(t),\dots, i_N(t)$ are the currents entering a node, KCL provides:
$$\sum_{k=1}^{N} i_k(t) = 0 (Eq. 10.82)$$
Substituting the phasor representation of the currents results in:
$$\sum_{k=1}^{N} \underline{I}_k e^{j \omega t} = 0 (Eq. 10.83)$$
Dividing equation (10.83) by $e^{j \omega t}$ results in:
$$\sum_{k=1}^{N} \underline{I}_k = 0 (Eq. 10.84)$$
So that KCL states that the sum of the phasor currents entering (or leaving) a node is zero.
Important Result:
KVL and KCL apply directly in the frequency domain.
Example10.8: RC Circuit Steady-state Sinusoidal Response
In this example, we will revisit example 10.3. In that example, we determined the capacitor voltage in the circuit to the left below, using phasor analysis techniques applied to the circuit’s time-domain governing equation. In this example, we will represent the circuit itself directly in the frequency domain, using impedance representations of the circuit element. The frequency-domain representation of the circuit is shown to the right below.
By the definition of impedance, we can determine the current through the capacitor to be:
$$\underline{I} = \frac{\underline{Y}}{\underline{Z}_C} = \frac{\underline{Y}}{\frac{1}{j \omega C}} = j \omega C \underline{Y}$$
The voltage across the resistor can now, by the definition of impedance, be written as $\underline{V}_R = R \cdot \underline{I} = R (j \omega C \underline{Y})$. We now apply KVL for phasors to the circuit to the right above, which leads to:
$$V_P \angle 0^{\circ} = R(j \omega C \underline{Y}) + \underline{Y}$$
Solving for $\underline{Y}$ in this equation provides $\underline{Y} = \frac{V_P \angle 0^{\circ}}{1+ j \omega RC}$
By the rules of complex arithmetic, we can determine the magnitude and phase angle of $\underline{Y}$ to be:
$$|\underline{Y}| = \frac{V_P}{\sqrt{1+(\omega RC)^2}}$$
$$\angle \underline{Y} = -\tan^{-1} (\omega RC)$$
And the time-domain solution for $y(t)$ is thus:
$$y(t) = \frac{V_P}{\sqrt{1+(\omega RC)^2}} \cos \left[ \omega t - \tan^{-1} (\omega RC) \right]$$
Parallel and Series Impedances & Circuit Reduction
Consider the case of N impedances connected in series, as shown in Figure 10.20. Since the elements are in series, and since we have seen that KCL applies to phasors, the phasor current $\underline{I}$ flows through each of the impedances. Applying KVL for phasors around the single loop, and incorporating the definition of impedance, we obtain:
$$\underline{V} = \underline{I} (\underline{Z}_1 + \underline{Z}_2 + \dots + \underline{Z}_N) = 0 (Eq. 10.85)$$
If we define $\underline{Z}_{eq}$ as the equivalent impedance of the series combination, we have $\underline{V}=\underline{I} \cdot \underline{Z}_{eq}$, where:
$$\underline{Z}_{eq} = \underline{Z}_1 + \underline{Z}_2 + \dots + \underline{Z}_N (Eq. 10.86)$$
So that impedances in series sum directly. Thus, impedances in series can be combined in the same way as resistances in series.
By extension of the above result, we can develop a voltage divider formula for phasors. Without derivation, we state that the phasor voltage across the kth impedance in a series combination of N impedances as shown in Figure 10.20 can be determined as:
$$\underline{V}_k = \underline{V} \frac{\underline{Z}_k}{\underline{Z}_1 + \underline{Z}_2 + \dots + \underline{Z}_N} (Eq. 10.87)$$
So that our voltage division relationships for resistors in series apply directly in the frequency domain for impedances in series.
We now consider the case of N impedances connected in parallel, as shown in Figure 10.21. Since the elements are in parallel, and KVL applied to each loop shows that all circuit elements share the same phasor voltage difference $\underline{V}$. Applying KCL for phasors at the upper node, and incorporating the definition of admittance, we obtain:
$$\underline{I}=\underline{V} (\underline{Y}_1 + \underline{Y}_2 + \dots + \underline{Y}_N) = 0 (Eq. 10.88)$$
If we define $\underline{Y}_{eq}$ as the equivalent impedance of the series combination, we have:
$$\underline{I} = \underline{V} \cdot \underline{Y}_{eq} (Eq. 10.89)$$
Where:
$$\underline{Y}_{eq} = \underline{Y}_1 + \underline{Y}_2 + \dots + \underline{Y}_N (Eq. 10.90)$$
So that admittances in series sum directly. Converting our admittances to impedances indicates that the equivalent impedance of a parallel combination of N impedances as shown in Figure 10.21 is:
$$\underline{Z}_{eq} = \frac{1}{\frac{1}{\underline{Z}_1} + \frac{1}{\underline{Z}_2} + \dots + \frac{1}{\underline{Z}_N}} (Eq. 10.91)$$
Thus, impedances in parallel can be combined in the same way as resistances in parallel.
By extension of the above result, we can develop a current divider formula for phasors. Without derivation, we state that the phasor current across the kth impedance in a series combination of N impedances as shown in Figure 10.21 can be determined as:
$$\underline{I}_k = \underline{I} \frac{\frac{1}{\underline{Z}_k}}{\frac{1}{\underline{Z}_1} + \frac{1}{\underline{Z}_2} + \dots + \frac{1}{\underline{Z}_N}} (Eq. 10.92)$$
So that our current division relationships for resistors in parallel apply directly in the frequency domain for impedances in parallel.
Important Result:
All circuit reduction techniques for resistances apply directly to the frequency domain for impedances. Likewise, voltage and current divider relationships apply to phasor circuits in the frequency domain exactly as they apply to resistive circuits in the time domain.
Example 10.9
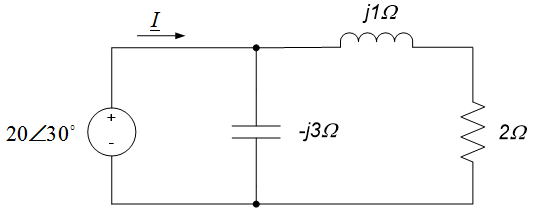
Use circuit reduction techniques to determine the current phasor $\underline{I}$ leaving the source in the circuit below. (Note: the circuit below is the frequency domain circuit we obtained in example 10.7.)
Since impedances in series add directly, the inductor and resistor can be combined into a single equivalent impedance of $(2+j1)\Omega$, as shown in the figure to the left below. The capacitor is then in parallel with this equivalent impedance. Since impedances in parallel add in the same way as resistors in parallel, the equivalent impedance of this parallel combination can be calculated by dividing the product of the impedances by their sum, so $\underline{Z}_{eq} = \frac{(-j3)(2+j1)}{(-j3)+(2+jl)} \Omega = \frac{3-j6}{2-j2} \Omega$. Converting this impedance to polar form results in $\underline{Z}_{eq} = 2.37 \angle - 18^{\circ} \Omega$; the final reduced circuit is shown in the figure to the right below.
Using the reduced circuit to the right above and the definition of impedance, we can see that:
$$\underline{I} = \frac{20 \angle 30^{\circ}}{2.37 \angle -18^{\circ} \Omega} = \frac{2}{2.37} \angle \left[ 30^{\circ} - (-18^{\circ}) \right]A$$
So that:
$$\underline{I} = 8.44 \angle 48^{\circ}A$$
Example 10.10
Use circuit reduction techniques to determine the current, $i(t)$ through the inductor in the circuit below.
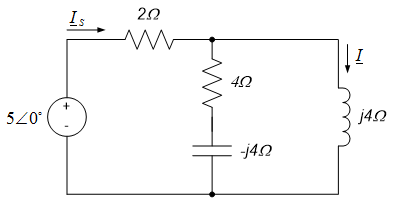
With $\omega=2$ rad/sec, the frequency domain representation of the circuit is as shown in the figure to the left below; in that figure, we have also defined the current phasor $\underline{I}_S$ leaving the source.
We now employ circuit reduction techniques to determine the phasor $\underline{I}$. To do this, we first determine the circuit impedance seen by the source; this impedance allows us to determine the source current $\underline{I}_S$. The current $\underline{I}$ can be determined from a current divider relation and $\underline{I}_S$.
The impedances of the series combination of the capacitor and the $4\Omega$ resistor is readily obtained by adding their individual impedances, as shown in the figure to the left below. This equivalent impedance is then in parallel with the inductor’s impedance; the equivalent impedance of this parallel combination is as shown in the circuit to the right below.
The source current is then, by the definition of impedance, $\underline{I}_S = \frac{5 \angle 0^{\circ}}{(4-j4) \Omega + 2 \Omega} = 0.69 \angle - 33.7^{\circ}$.
The circuit to the left above, along with our voltage divider formula, provides:
$$\underline{I} = \frac{(4-j4)\Omega}{(4-j4)\Omega + j4\Omega} \cdot \underline{I}_S = (1-j1) \Omega \cdot 0.69 \angle - 33.7^{\circ} = 0.98 \angle - 78.7^{\circ}$$
And the current $i(t)=0.98 \cos(2t -78.7^{\circ})$.
Nodal and Mesh Analysis
Nodal analysis and mesh analysis techniques have been previously applied to resistive circuits in the time domain. In nodal analysis, we applied KCL at independent nodes and used Ohm’s Law to write the resulting equations in terms of the node voltages. In mesh analysis, we applied KVL and used Ohm’s Law to write the resulting equations in terms of the mesh currents.
In the frequency domain, as we have seen in previous sub-sections, KVL and KCL apply directly to the phasor representations of voltages and currents. Also, in the frequency domain, impedances can be used to represent voltage-current relations for circuit elements in the frequency domain in the same way that Ohm’s Law applied to resistors in the time domain (the relation $\underline{V}=\underline{I} \cdot \underline{Z}$ in the frequency domain corresponds exactly to the relation $v(t)=R \cdot i(t)$ in the time domain). Thus, nodal analysis and mesh analysis apply to frequency domain circuits in exactly the same way as to time domain resistive circuits, with the following modifications:
- The circuit excitations and responses are represented by phasors
- Phasor representations of node voltages and mesh currents are used
- Impedances are used in the place of resistances
Application of nodal and mesh analysis to frequency-domain circuit analysis is illustrated in the following examples.
Example 10.11
Use nodal analysis to determine the current $i(t)$ in the circuit of example 10.10.
The desired frequency-domain circuit was previously determined in Example 10.10. Nodal analysis of the frequency-domain circuit proceeds exactly as was done in the case of resistive circuits. The reference voltage, $V_R = 0$, and our single node voltage, $V_A$, for this circuit are defined on the circuit below.
Applying KCL in phasor form at node A provides:
$$\frac{5 \angle 0^{\circ} - \underline{V}_A}{2 \Omega} - \frac{\underline{V}_A}{(4-j4) \Omega} - \frac{\underline{V}_A}{j4 \Omega} = 0$$
Solving for $\underline{V}_A$ gives $\underline{V}_A = 3.92 \angle 11.31^{\circ}V$. By the definition of impedance, the desired current phasor $\underline{I}= \frac{\underline{V}_A}{j4 \Omega} = \frac{3.92 \angle 11.31^{\circ}}{4 \angle 90^{\circ}} = 0.98 \angle - 78.7^{\circ}$ so that $i(t)=0.98 \cos(2t - 78.7^{\circ})$, which is consistent with our result obtained via circuit reduction in Example 3.
Example 10.12
Use mesh analysis to determine the current i(t) in the circuit of examples 10.10 and 10.11.
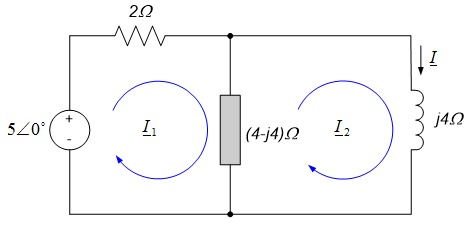
The desired frequency-domain circuit was previously determined in Example 10.10. Mesh analysis of the frequency-domain circuit proceeds exactly as for resistive circuits. The figure below shows our choice of mesh loops; the series resistor-capacitor combination has been combined into a single equivalent resistance in the figure below, for clarity.
KVL around the mesh loop $\underline{I}_1$ provides:
$$5 \angle 0^{\circ} - 2 \cdot \underline{I}_1 - (4-j4)(\underline{I}_1-\underline{I}_2) = 0$$
KVL around the mesh loop $\underline{I}_2$ provides:
$$(4-j4)(\underline{I}_2-\underline{I}_1) + j4 \cdot \underline{I}_2 = 0$$
The second equation above can be simplified to provide: $\underline{I}_2 = (1-j)\underline{I}_1$. Using this result to eliminate $\underline{I}_1$ in the mesh equation for loop $\underline{I}_1$ and simplifying provides:
$$5 \angle 0^{\circ} = \left[ \frac{(6-j4)}{1-j}+ (j4-4) \right] \underline{I}_2$$
So that $\underline{I}_2 = 0.98 \angle - 78.7^{\circ}$. The mesh current $\underline{I}_2$ is simply the desired current $\underline{I}$, so in the time domain,
$$i(t)=0.98 \cos(2t - 78.7^{\circ})$$
Which is consistent without results from examples 10.10 and 10.11.
Important Result:
Nodal and mesh analysis methods apply to phasor circuits exactly as they apply to resistive circuits in the time domain. Impedances simply replace resistances, and quantities of interest become complex valued.
Superposition
The extension of superposition to the frequency domain is an extremely important topic. Several common analysis techniques you will encounter later in this course and in future courses (frequency response, Fourier Series, and Fourier Transforms, for example) will depend heavily upon the superposition of sinusoidal signals. In this sub-section, we introduce the basic concepts involved.
In all of our steady-state sinusoidal analyses, we have required that the circuit is linear. (The statement that the steady state response to a sinusoidal input is a sinusoid at the same frequency requires the system to be linear. Nonlinear systems do not necessarily have this characteristic.) Thus, all phasor circuits are linear and superposition must apply. Thus, if a phasor circuit has multiple inputs, we can calculate the response of the circuit to each input individually and sum the results to obtain the overall response. It is important to realize, however, that the final step of summing the individual contributions to obtain the overall response can, in general, only be done in the time domain. Since the phasor representation of the circuit response implicitly assumes a particular frequency, the phasor representations cannot be summed directly. The time domain circuit response, however, explicitly provides frequency information, allowing those responses to be summed.
In fact, because the frequency-domain representation of the circuit depends upon the frequency of the input (in general, the impedances will be a function of frequency), the frequency domain representation of the circuit itself is, in general, different for different inputs. Thus, the only way in which circuits with multiple inputs at different frequencies can be analyzed in the frequency domain is with superposition.
In the special case in which all inputs share a common frequency, the circuit response can be determined by any of our previous analysis techniques (circuit reduction, nodal analysis, mesh analysis, superposition, etc.) In this case, if superposition is used, the circuit response to individual inputs can be summed directly in the frequency domain if desired.
Examples of the application of superposition to analysis of frequency-domain circuits are provided below.
Important Result:
In the case of multiple frequencies existing in the circuit, superposition is the only valid frequency-domain analysis approach.
Superposition applies directly in the frequency domain, insofar as contributions from individual sources can be determined by killing all other sources and analyzing the resulting circuit. In general, however, superimposing (summing) the contributions from the individual sources must be done in the time domain.
Superposition of responses to individual sources can be summed directly in the frequency domain (e.g. addition of the phasors representing the individual responses) is only appropriate if all sources have the same frequency. In this case (all source having the same frequency) any of our other modeling approaches are also valid.
Example 10.13
Determine the voltage $v(t)$ across the inductor in the circuit below.
Since two different input frequencies are applied to the circuit, we must use superposition to determine the response. The circuit to the left below will provide the phasor response $\underline{V}_1$ to the current source; the frequency is $\omega = 9$ rad/sec and the voltage source is killed. The circuit to the right below will provide the phasor response $\underline{V}_2$ to the voltage source; the frequency is $\omega = 3$ rad/sec and the current source is killed.
To determine the voltage phasor resulting from the current source ($\underline{V}_1$ in the circuit to the left above), we note that the inductor and the $3\Omega$ resistor form a current divider. Thus, the current through the inductor resulting from the current source is $\underline{I}_1 = \frac{3 \Omega}{(3+j3)\Omega} \cdot 6 \angle 0^{\circ} = \frac{3 \angle 0^{\circ} \cdot \angle 0^{\circ}}{3 \sqrt{2} \angle 45^{\circ}} = \frac{6}{\sqrt{2}} \angle -45^{\circ}$. The voltage phasor $\underline{V}_1$ can then be determined by multiplying this current times the inductor's impedance:
$$\underline{V}_1 = j3 \Omega \cdot \frac{6}{\sqrt{2}} \angle - 45^{\circ} = 3 \angle 90^{\circ} \cdot \frac{6}{\sqrt{2}} \angle -45^{\circ}V$$
And the time-domain voltage across the inductor due to the current source is:
$$v_1(t) = 9 \sqrt{2} \cos(9t + 45^{\circ})V$$
To determine the voltage phasor resulting from the voltage source ($\underline{V}_2$ in the circuit to the right above), we note that the inductor and the $3 \Omega$ resistor now form a voltage divider. Thus, the voltage $\underline{V}_2$ can be readily determined by:
$$\underline{V}_2 = \frac{j1 \Omega}{(3+j1)\Omega} \cdot 4 \angle 30^{\circ} = \frac{1 \angle 90^{\circ} \cdot 4 \angle 30^{\circ}}{\sqrt{10} \angle 18.4^{\circ}} = \frac{4}{\sqrt{10}} \angle 101.6^{\circ}$$
So that the time-domain voltage across the inductor due to the voltage source is:
$$v_2(t) = \frac{4}{\sqrt{10}} \cos(3t + 101.6^{\circ})V$$
The overall voltage is then the sum of the contributions from the two sources, in the time domain, so:
$$v(t)=v_1(t)+v_2(t)$$
And:
$$v(t)=9 \sqrt{2} \cos(9t + 45^{\circ}) + \frac{4}{\sqrt{10}} \cos(3t + 101.6^{\circ})V$$
Example 10.14
Determine the voltage $v(t)$ across the inductor in the circuit below.
This circuit is essentially the same as the circuit of Example 10.13, with the important difference that the frequency of the voltage input has changed – the voltage source and current source both provide the same frequency input to the circuit, 9 rad/sec. We will first do this problem using superposition techniques. We will then use nodal analysis to solve the problem, to illustrate that multiple inputs at the same frequency do not require the use of superposition.
Individually killing each source in the circuit above results in the two circuits shown below. Note that the impedance of the inductor is now the same in both of these circuits.
The two circuits shown above will now be analyzed to determine the individual contributions to the inductor voltage; these results will then be summed to determine the overall inductor voltage.
The circuit to the left above has been analyzed in Example 6. Therefore, the voltage phasor $\underline{V}_1$ is the same as determined in Example 10.13:
$$\underline{V}_1 = 9 \sqrt{2} \angle 45^{\circ}V$$
The voltage $\underline{V}_2$ in the circuit to the right above can be determined from application of the voltage divider formula for phasors:
$$\underline{V}_2 = \frac{j3\Omega}{(3+j3)\Omega} \cdot 4 \angle 30^{\circ} = \frac{3 \angle 90^{\circ} \cdot 4 \angle 30^{\circ}}{3 \sqrt{2} \angle 45^{\circ}} = 2 \sqrt{2} \angle 75^{\circ}$$
Since both inputs have the same frequency, we can superimpose the phasor results directly (we could, of course, also determine the individual time domain responses and superimpose those responses if we chose):
$$\underline{V} = \underline{V}_1 + \underline{V}_2 = 9 \sqrt{2} \angle 45^{\circ} + 2 \sqrt{2} \angle 75^{\circ} = 15.24 \angle 50.3^{\circ}V$$
So that the time domain inductor voltage is $v(t) = 15.24 \cos(9t + 50.3^{\circ})V$. Notice that the circuit response has only a single frequency component, since both inputs have the same frequency.
The superposition approach provided above is entirely valid. However, since both sources have the same input, we can choose any of our other analysis approaches to perform this problem. To emphasize this fact, we choose to do this problem using nodal analysis.
The frequency-domain circuit, with our definition of reference voltage and independent node, is shown in the figure below.
KCL at node A provides:
$$6 \angle 0^{\circ} = \frac{\underline{V}_A - 0}{j3\Omega} + \frac{\underline{V}_A - 4 \angle 30^{\circ}}{3\Omega}$$
Solving the above equation for $\underline{V}_A$ provides $\underline{V}_A = 15.24 \angle 50.3V$ so that the inductor voltage as a function of time is:
$$v(t)=15.24 \cos(9t+50.3^{\circ})V$$
Which is consistent with our result using superposition.
Thévenin’s & Norton’s Theorems, Source Transformations, and Maximum Power Transfer
Application of Thévenin’s and Norton’s Theorems to frequency domain circuits is identical to their application to time domain resistive circuits. The only differences are:
- The open circuit voltage ($V_{OC}$) and short circuit current ($i_{SC}$) determined for resistive circuits is replaced by their phasor representations, $\underline{V}_{OC}$ and $\underline{I}_{SC}$.
- The Thévenin resistance, $R_{TH}$, is replaced by a Thévenin impedance, $\underline{Z}_{TH}$.
Thus, the Thévenin and Norton equivalent circuits in the frequency domain are as shown in Figure 10.22.
Since Thévenin’s and Norton’s Theorems both apply in the frequency domain, the approaches we used for source transformations in the time domain for resistive circuits translate directly to the frequency domain, with impedances substituted for resistances and phasors used for voltage and current terms.
In order to determine the load necessary to draw the maximum power from a Thévenin equivalent circuit, we must re-derive the maximum power result obtained previously for resistive circuits, substituting impedances for admittances and using phasors for source terms. We will not derive the governing relationship, but will simply state that, in order to transfer the maximum power to a load, the load impedance must be the complex conjugate of the Thévenin impedance of the circuit being loaded. Thus, if a Thévenin equivalent circuit has some impedance $\underline{Z}_{TH}$ with a resistance $R_{TH}$ and a reactance $X_{TH}$, the load which will draw the maximum power from this circuit must have resistance $R_{TH}$ and a reactance – $X_{TH}$. The appropriate loaded circuit is shown in Figure 10.23 below.
Example 10.15
Determine the Thévenin equivalent circuit seen by the load in the circuit below.
In the circuit below, we have used the input frequency, $\omega = 2$ rad/sec, to convert the circuit to the frequency domain.
Removing the load and killing the source allows us to determine the Thévenin resistance of the circuit. The appropriate circuit is:
The parallel combination of two, $2\Omega$ resistors have an equivalent resistance of $1\Omega$. This impedance, in series with the $j1\Omega$ impedance, results in a Thévenin impedance $\underline{Z}_{TH} = (1 + j1)\Omega$. Replacing the source, but leaving the load terminals open-circuited, as shown in the figure below, allows us to determine the open-circuit voltage $\underline{V}_{OC}$.
Since there is no current through the inductor, due to the open-circuit condition, $\underline{V}_{OC}$ is determined from a simple resistive voltage divider formed by the two, $2\Omega$ resistors. Thus, the open-circuit voltage is:
$$\underline{V}_{OC} = \frac{2\Omega}{2\Omega + 2\Omega} \cdot 2 \angle 0^{\circ} = 1 \angle 0^{\circ}$$
The resulting Thévenin equivalent circuit is shown below:
Example 10.16
Determine the Norton equivalent circuit of the circuit of example 10.15.
Since we determined the Thévenin equivalent circuit in Example 10.15, a source transformation can be used to determine the Norton equivalent circuit. Consistent with our previous source transformation rules, the short- circuit current, $\underline{I}_{SC}$, is equal to the open-circuit voltage divided by the Thévenin impedance:
$$\underline{I}_{SC} = \frac{\underline{V}_{OC}}{\underline{Z}_{TH}} = \frac{1 \angle 0^{\circ}}{(1+j1)\Omega} = \frac{1 \angle 0^{\circ}}{\sqrt{2} \angle 45^{\circ}} = \frac{1}{\sqrt{2}} \angle -45^{\circ}$$
Since the impedance doesn’t change during a source transformation, the Norton equivalent circuit is therefore as shown below:
Example 10.17
Determine the load impedance for the circuit of Example 10.15 which will provide the maximum amount of power to be delivered to the load. Provide a physical realization (a circuit) which will provide this impedance.
The maximum power is delivered to the load when the load impedance is the complex conjugate of the Thévenin impedance. Thus, the load impedance for maximum power transfer is:
$$\underline{Z}_L = (1-j)\Omega$$
And the loaded Thévenin circuit is:
To implement this load, let us look at a parallel RC combination. With the frequency $\omega = 2$ rad/sec, the frequency domain load looks like:
Combining parallel impedances results in:
$$\underline{Z}_L = \frac{-j(\frac{R}{2C})}{R-\frac{j}{2C}}\Omega = \frac{\frac{R}{4C^2}-j\frac{R^2}{2C}}{R^2+\frac{1}{4C^2}}\Omega$$
Setting $R = 2\Omega$ and $C = 0.25F$ makes $\underline{Z}_L = (1 - j )\Omega$, as desired, so the physical implementation of our load is as shown below:
Section Summary
- The following analysis methods apply in the frequency domain exactly as they do in the time domain for purely resistive circuits
- KVL and KCL
- Voltage and current dividers
- Circuit reduction techniques
- Nodal and mesh analysis
- Superposition, especially when multiple frequencies are present
- Thévenin’s and Norton’s theorems
One simply uses phasor representations for the voltages and/or currents in the circuit and impedances to represent the circuit element voltage-current relationships. The analysis techniques presented Chapters 1 through 4 are then applied exactly as they were for resistive circuits.
- One minor exception to the above statement is that, in order to draw maximum power from a circuit, the load impedance should be the complex conjugate of the impedance of the circuit’s Thévenin equivalent.
Exercises
1. Determine the impedance seen by the source for the circuit below if $u(t)=4 \cos(t+30^{\circ})$.
2. Determine the impedance seen by the source for the circuit below if $u(t) = 2 \cos(4000t)$.
3. For the circuit of exercise 1, determine the current delivered by the source.
4. For the circuit of exercise 2, determine the voltage across the $8\Omega$ resistors.
10.6: Frequency Domain System Characterization
In Chapters 7 and 8, we wrote the differential equation governing the relationship between a circuit’s input and output (the input-output equation) and used this differential equation to determine the response of a circuit to some input. We also characterized the time-domain behavior of the system by examining the circuit’s natural and step responses. We saw that the behavior of a first order circuit can be characterized by its time constant and DC gain, while the response of a second order circuit is characterized by its natural frequency, damping ratio and DC gain. It is important to recognize that these characterizations were independent of specific input parameters; they depended upon the type of response (e.g. a step function or a natural response), but were independent of detailed information such as the amplitude of the step input or the actual values of the initial conditions.
We will now use the steady state sinusoidal response to characterize a circuit’s behavior. As in the case of our time-domain characterization, this characterization will allow the system’s behavior to be defined in terms of its response to sinusoidal inputs, but the characterization will be independent of details such as the input sinusoid’s amplitude or phase angle. (The input sinusoid’s frequency will, however, still be of prime importance.)
When a sinusoidal input is applied to a linear system, the system’s forced response consists of a sinusoid with the same frequency as the input sinusoid, but in general having a different amplitude and phase from the input sinusoid. Figure 10.24 shows the general behavior, in block diagram form. Changes in the amplitude and phase angle between the input and output signals are often used to characterize the circuit’s input-output relationship at the input frequency, $\omega$. In this chapter, we will demonstrate how this characterization is performed for inputs with discrete frequencies (as in the case of circuits with one or several inputs, each with a single frequency component). Later chapters will extend these concepts to the case in which frequency is considered to be a continuous variable.
Previously in this chapter, we have (bit-by-bit) simplified the analysis of a system’s steady state sinusoidal response significantly. We first represented the sinusoidal signals as complex exponentials in order to facilitate our analysis. We subsequently used phasors to represent our complex exponential signals, as shown in Figure 10.25; this allowed us to represent and analyze the circuit’s steady state sinusoidal response directly in the frequency domain.
In the frequency domain analyses performed to date, we have generally determined the system’s response to a specific input signal with a given frequency, amplitude, and phase angle. We now wish to characterize the system response to an input signal with a given frequency, but an arbitrary amplitude and phase angle. As indicated previously in section 10.1, we will see that the input-output relationship governing the system reduces to a relationship between the output and input signal amplitudes and the output and input signal phases. The circuit can thus be represented in phasor form as shown in Figure 10.26. The system’s effect on a sinusoidal input consists of an amplitude gain between the output and input signals ($\frac{B}{A}$ in Figure 10.26) and a phase difference between the output and input signals ($\phi - \theta$ in Figure 10.26).
Rather than perform a rigorous demonstration of this property at this time, we will simply provide some simple examples to illustrate the basic concept.
Example 10.18
A sinusoidal voltage, $v_{in}(t)$, is applied to the circuit to the left below. Determine the frequency-domain relationship between the phasor representing $v_{in}(t)$ and the phasor representing the output voltage $v_{out}(t)$.
Since the frequency is unspecified, we leave frequency as an independent variable, $\omega$, in our analysis. In the frequency domain, therefore, the circuit can be represented as shown to the right above. The frequency domain circuit is a simple voltage divider, so the relation between input and output is:
$$\underline{V}_{out} = \frac{\frac{1}{j \omega C}}{R+ \frac{1}{j \omega C}} \cdot \underline{V}_{in} = \frac{1}{1+j \omega RC} \cdot \underline{V}_{in}$$
The factor $\frac{1}{1+j \omega RC}$ is a complex number, for given values of $\omega$, R, and C. It constitutes a multiplicative factor which, when applied to the input, results in the output. This multiplicative factor is often used to characterize the system’s response at some frequency, $\omega$. We will call this multiplicative factor the frequency response function, and denote it as $H(j \omega)$. For a particular frequency, $H(j \omega)$ is a complex number, with some amplitude, $|H(j \omega)|$ , and phase angle, $\angle H(j \omega)$. For our example, the magnitude and phase of our frequency response function are:
$$|H(j \omega)| = \frac{1}{\sqrt{1+(\omega RC)^2}}$$
$$\angle H(j \omega) = - \tan^{-1}(\omega RC)$$
According to the rules of multiplication of complex numbers, when two complex numbers are multiplied, the magnitude of the result is the product of the magnitudes of the individual numbers, and the phase angle of the result is the sum of the individual phase angles. Thus, if the input voltage is represented in phasor form as $\underline{V}_{in} = |V_{in}| \cdot |H(j \omega)|$ and the output voltage is $\underline{V}_{out} = |V_{out}| \angle \phi$, it is easy to obtain the output voltage from the input voltage and the frequency response function:
$$|V_{out}| = |V_{in}| \cdot |H(j \omega)|$$
$$\angle V_{out} = \angle V_{in} + \angle H(j \omega)$$
Example 10.19
Use the frequency response function determined in Example 10.18 above to determine the response $v_{out}(t)$ of the circuit shown below to the following input voltages:
- $v_{in}(t)= 3 \cos(2t+20^{\circ})$
- $v_{in}(t)= 7 \cos(4t-60^{\circ})$
When $v_{in}(t) = 3 \cos(2t+20^{\circ})$, $\omega = 2$ rad/sec, $|V_{in}| = 3$ and $\angle V_{in} = 20^{\circ}$. For this value of $\omega$, and the given values of R and C, the magnitude and phase of the frequency response function are:
$$|H(j2)|= \frac{1}{\sqrt{1+(\omega RC)^2}} = \frac{1}{\sqrt{1+(2 \cdot 2\Omega \cdot 0.25F)^2}} = \frac{1}{\sqrt{1+1^2}}=\frac{1}{\sqrt{2}}$$
$$\angle H(j2) = -\tan^{-1} (\omega RC) = -\tan^{-1} (2 \cdot 2 \Omega \cdot 0.25F) = -\tan^{-1} (1) = -45^{\circ}$$
The output amplitude is then the product of $|V_{in}|$ and $|H(j2)|$ and the output phase is the sum of $\angle V_{in}$ and $\angle H(j2)$, so that:
$$|V_{out}| = |V_{in}| \cdot |H(j2)| = 3 \cdot \frac{1}{\sqrt{2}} = \frac{3}{\sqrt{2}}$$
$$\angle V_{out} = \angle V_{in} + \angle H(j2) = 20^{\circ} + (-45^{\circ}) = -25^{\circ}$$
And the time-domain output voltage is:
$$v_{out}(t) = \frac{3}{\sqrt{3}} \cos(2t-25^{\circ})$$
When $v_{in} = 7 \cos(4t-60^{\circ})$, $\omega = 4$ rad/sec, $|V_{in}|=7$ and $\angle V_{in} = -60^{\circ}$. For this value of $\omega$, and the given values of R and C, the magnitude and phase of the frequency response function are:
$$|H(j4)|= \frac{1}{\sqrt{1+(\omega RC)^2}}=\frac{1}{\sqrt{5}}$$
And:
$$\angle H(j4) = -\tan^{-1}(\omega RC) = -63.4^{\circ}$$
The output amplitude is then the product of $|V_{in}|$ and $|H(j4)|$ and the output phase is the sum of $\angle V_{in}$ and $\angle H(j4)$ so that the time-domain output voltage in this case is:
$$v_{out}(t) = \frac{7}{\sqrt{5}} \cos(2t-123.4^{\circ})$$
From the above examples we can see that, once the frequency response function is calculated for a circuit as a function of frequency, we can determine the circuit’s steady-state response to any input sinusoid directly from the frequency response function, without re-analyzing the circuit itself.
We conclude this section with one additional example, to illustrate the use of the frequency response function and superposition to determine a circuit’s response to multiple inputs of different frequencies.
Example 10.20
Use the results of examples 10.18 and 10.19 above to determine the response $v_{out}(t)$ of the circuit shown below if the input voltage is $v_{in}(t) = 3 \cos(2t+20^{\circ}) + 7 \cos(4t-60^{\circ})$. Plot the input and output waveforms.
Recall, from section 10.5, that superposition is the only valid approach for performing frequency domain analysis of circuits with inputs at multiple frequencies. Also recall that each frequency can be analyzed separately in the frequency domain, but that the superposition process (the summation of the individual contributions) must be done in the time domain. For this problem, we have contributions at two different frequencies: 2 rad/sec and 4 rad/sec. Luckily, we have determined the individual responses of the circuit to these two inputs in Example 10.19. Therefore, in the time domain, the two contributions to our output will be:
$$v_1(t) = \frac{3}{\sqrt{2}} \cos(2t-25^{\circ})$$
And:
$$v_2(t) = \frac{7}{\sqrt{5}} \cos(2t-123.4^{\circ})$$
The overall response is then:
$$v_{out}(t) = v_1(t) + v_2(t) = \frac{3}{\sqrt{2}} \cos(2t-25^{\circ}) + \frac{7}{\sqrt{5}} \cos(2t-123.4^{\circ})$$
A plot the input and output waveforms is shown below:
Section Summary
- The frequency response function or frequency response describes a circuit’s input-output relationship directly in the frequency domain, as a function of frequency.
- The frequency response is a complex function of frequency $H(j \omega)$ (that is, it is a complex number which depends upon the frequency). This complex function is generally expressed as a magnitude and phase, $|H(j \omega)|$ and $\angle H(j \omega)$, respectively. $|H(j \omega)|$ is called the magnitude response of the circuit, and $\angle H(j \omega)$ is called the phase response of the circuit. The overall idea is illustrated in the block diagram below:
- The magnitude response of the circuit is the ratio of the output amplitude to the input amplitude. This is also called the gain of the system. Thus, in the figure above, the output amplitude $B = |H(j \omega)| \cdot A$. Note that the magnitude response or gain of the system is a function of frequency, so that inputs of different frequencies will have different gains.
- The phase response of the circuit is the difference between the output phase angle and the input phase angle. Thus, in the figure above, the output phase $\phi = \angle H(j \omega) + \theta$. Like the gain, the phase response is a function of frequency – inputs at different frequencies will, in general, have different phase shifts.
- Use of the frequency response to perform circuit analyses can be particularly helpful when the input signal contains a number of sinusoidal components at different frequencies. In this case, the response of the circuit to each individual component can be determined in the frequency domain using the frequency response and the resulting contributions summed in the time domain to obtain the overall response.
Exercises
1. Determine the voltage across the capacitor in the circuit below if $u(t) = 4 \cos(t+30^{\circ}) + 2cos(2t-45^{\circ})$. (Hint: this may be easier if you find the response to the input as a function of frequency, evaluate the response for each of the above frequency components, and superimpose the results.)
2. Determine the voltage across the resistors in the circuit below if $u_1(t) = 4 \cos(2t)$ and if $u_2(t) = \cos(4t)$. (Hint:this may be easier if you find the response to the input as a function of frequency, evaluate the response for each of the above frequency components, and superimpose the results.)

