This is an old revision of the document!
Using the Protocol Analyzer (Under Construction)

Introduction
This guide explains the use of the Protocol instrument in WaveForms. This instrument is used to send, receive, and spy on transactions in a variety of different digital communication protocols.
Prerequisites
- A Digilent Test & Measurement Device with Digital Input/Output Channels
- A Computer with WaveForms Software Installed
1. Opening the Protocol Analyzer
1.1
Plug in the Test & Measurement Device, then start WaveForms and make sure the device is connected.
If no device is connected to the host computer when WaveForms launches, the Device Manager will be launched. Make sure that the device is plugged in and turned on, at which point it will appear in the Device Manager's device list (1). Click on the device in the list to select it, then click the Select button (2) to close the Device Manager.
Note: “DEMO” devices are also listed, which allow the user to use WaveForms and create projects without a physical device.
Note: The Device Manager can be opened by clicking on the “Connected Device” button in the bottom right corner of the screen (3), or by selecting “Device Manager” from the “Settings” menu at the top of the screen.

1.2
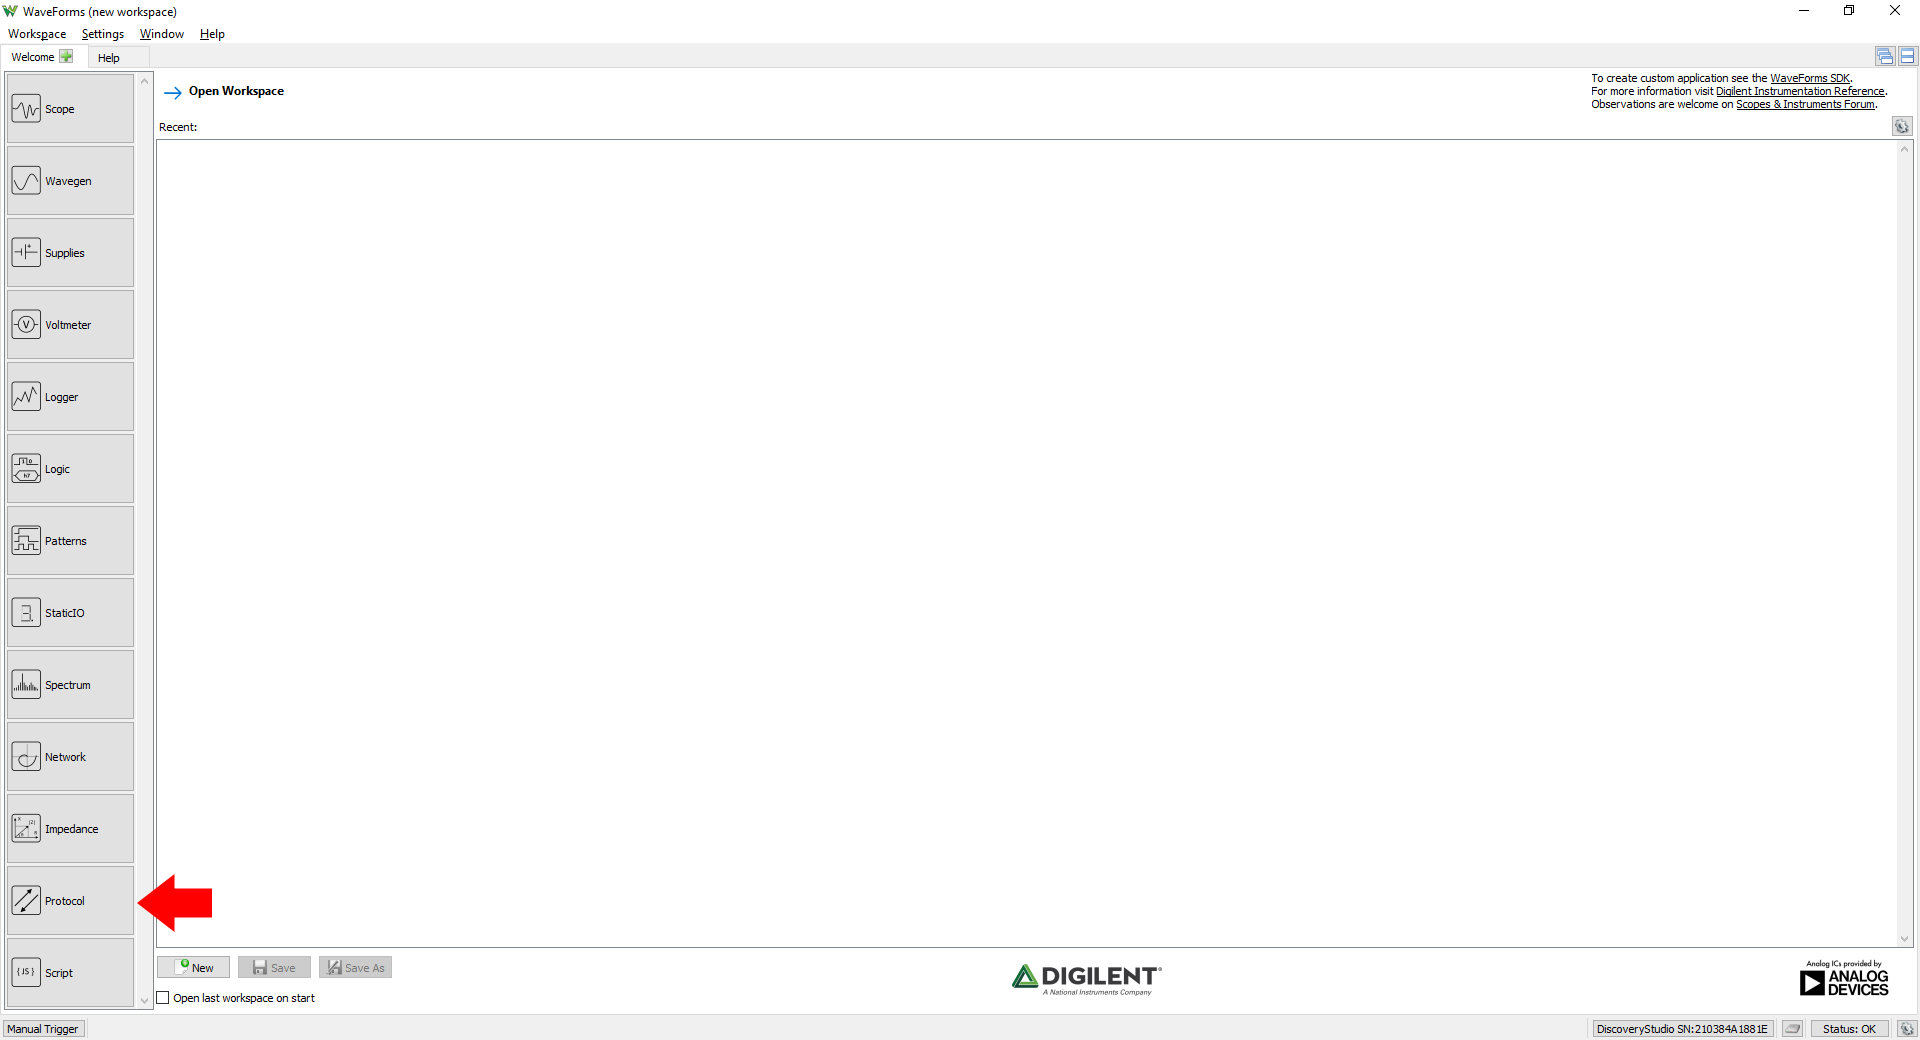
Once the Welcome page loads, in the instrument panel at the left side of the window, click on the Protocol button to open the Protocol Analyzer instrument.
1.3
Once the Protocol Analyzer instrument opens, the window contains the spy panel (1.) showing captured data, the configuration panel (2.) above the spy panel, and the control toolbar (3.) at the top of the window.

2. Using the Protocol Analyzer
The Protocol Analyzer can be used to spy on protocol communications to validate data flow. It may also be used to drive protocol communication to verify peripheral functionality. This section explains how to spy and then drive communication.
2.1 Hardware Setup
To demonstrate the capabilities of the Protocol Analyzer instrument, this guide uses a PmodAD5 and an Arduino UNO to spy on the SPI communications taking place between the host and peripheral. Afterwards, the Test and Measurement device will be used as the SPI master to drive communications with the PmodAD5. Make the pin connections as seen in each row of the table below:
| Test & Measurement Device | Arduino Uno | Pmod AD5 |
|---|---|---|
| DIO 0 and DIO 1 | N/A | N/A |
| Ground (down arrow) | GND | GND |
| N/A | 5V | VCC |
| N/A | Digital Pin 10 | CS |
| N/A | Digital Pin 11 | MOSI |
| DIO 3 | Digital Pin 12 | MISO |
| N/A | Digital Pin 13 | SCK |

2.2 Arduino Setup
Note: This guide assumes the Arduino 1.8.9 toolset is already installed.
Click Sketch>Include Library>Manage Libraries. In the search filter type AD7193 and install the library by Anne Mahaffey. Once the download has finished, close the Library Manager window, then click File>Examples>AD7193>AD7193_VoltageMeasure_Example. Click Upload to program the Arduino with the example sketch.

2.3 Software Setup
Back in WaveForms, click the SPI tab below the menu bar.

When the SPI tab is opened, it is initially set to spy on the data sent on MISO and MOSI, however it must be configured to match the PmodAD5 SPI communication properties. In the configuration panel, set the frequency to 1 MHz, the clock polarity to 1 and the clock phase to 1 (SPI Mode 3).

2.3 Protocol Spying
Click  Receive to begin spying on the data transmission between the Arduino and PmodAD5. The capture panel will start populating with data sent between the Arduino and the PmodAD5. Each line beginning with “Data:” represents a stream of data from when chip select goes low to when it goes high (in an Active Low Chip Select configuration, each line is measured by Chip Select going high then low). Each 8 bit packet is separated by a comma, with the MOSI and MISO data printed respectively, separated by a “|”.

2.4 Logic Analyzer
The Logic Analyzer can be used alongside the Protocol Analyzer to visualize the timing of the data being sent. In the Protocol Analyzer click the Logic Analyzer button in the top right corner, which opens the Logic Analyzer instrument.

In order to show both the Protocol Analyzer and the Logic Analyzer instruments on the screen at once, click on the Docking Windows button () in the top right corner of the screen.
Note: To return to the default tabbed view later, click on the “Tabbed Windows” button () adjacent to the Docking Windows button.
Click the Docking Windows button, further up in the top right corner, to split the screen between the Protocol Analyzer and Logic Analyzer.

Click the “Protocol” button then SPI MOSI to set a trigger on the MOSI pin. A SPI Trigger popup window will open. Change Value to h58 to observe the PmodAD5 sample data being sent.
Note: The Protocol Analyzer can't be used for spying if the Logic Analyzer is enabled.
Close the Logic Analyzer by clicking the x in the top right corner.

2.5 Driving Communications
The Protocol Analyzer may also be used to drive peripheral communications. To begin, remove the 4 data connections between the Arduino and PmodAD5, keeping the 5V and GND pins connected. Next, click the Master tab.
Set mode to Read Write. Next, in the Write (DQ0) section, write h08 h38 h00 h64 h58 h00 h00 h00 h00. Clicking the Execute button will execute the SPI transmission, populating the Read (DQ1) section with the response, as well as outputting the write and read packets in the text box below.

3. Protocol Analyzer User Interface Overview
This section describes the various controls present in the Protocol Analyzer instrument.
The Protocol Analyzer interface is separated into a settings panel and a communication panel. The settings panel is used to configure which pins will be used for a protocol’s transmission and the protocol’s properties. The communication panel is where data may be inputted for transmission and incoming data is displayed. Each protocol has different settings and communication panels which will be discussed in the following sections.
3.1 UART Interface
The UART settings panel is used to assign TX and RX to DIO pins. The settings panel is also used to configure properties of the UART protocol such as polarity, parity, baud rate, bit length, stop length and ending character(s).
 UART settings
The communications panel contains a TX field and a RX field. The TX field has a text box where characters to be sent may be typed out. With the Auto option checked, characters are sent as they are typed. Otherwise, characters may be sent by clicking Send or hitting the Enter key. When Escape is enabled, escaped characters (\t, \n, \0, etc.) will be accepted. Clicking the Send File () button will transmit the contents of the selected file.
In the RX field, clicking Receive () will cause the instrument to listen for incoming data on the RX pin. Clicking Stop () causes it to cease listening. Clicking Receive to File () has the instrument listen for data and saving it to a local file. Clicking cancel stops this process. Checking TX Echo causes any data transmitted using the TX field with also be displayed within the RX field. Size of the RX field text may be adjusted with (plus) and (minus) above and to the right of the text field. The field may be cleared with (clean) and its contents saved () or appended () to a file.
UART comm.
3.2 SPI Interface
The settings panel is used to configure which pins are used for chip select, clock, MOSI and MISO, the chip select active level, clock frequency, polarity, phase, bit transmission order and word transmission order.
SPI settings
The communications panel exposes four different modes of functionality, selected using the tabs at the top of the panel. Spy mode simply configures the instrument to listen for incoming data on the MISO pin. Mode allows selection between Three-wire, Standard, Dual and Quad modes.
Master mode allows the instrument to act as a SPI master. Mode allows selection of transmission mode, Command bits specifies command word length, Command specifies the command word which is sent before the read and/or write operation, Word bits specifies the word length, Words is the number of words for the next transmission, Write specifies the words to send and Read shows the read words. When writing, data can be represented in binary, decimal or hexadecimal format, and may be imported from a binary or text file using the Open button. Likewise, data can be saved to a binary or text file using Save or Append when reading.
Custom mode allows a communication script to be written. Please see the Protocol Help page for available functions and their descriptions. Sensor mode also allows for a communication script to be written, which will be executed at a precise timing and for a specified number of iterations.
3.3 I2C Interface
Settings panel allows SCL and SDA pins to be defined, clock frequency and enable Clock stretching. The specified frequency is used to filter glitches
I2C settings
I2C COMM
I2C comm.
3.4 CAN Interface
Settings allows configuration of the Test and Measurement pins that are used for TX and RX, the data polarity and the data rate.
CAN settings
The communication panel contains a TX and an RX field. The TX field has an input for data to be transmitted. Clicking Execute will send the data. The TX field also has an ID input for the device identifier. Checking Extended will use an extended device identifier. Selecting Remote will instruct the instrument to send a Remote Frame, while leaving it unchecked instructs it to send a Data Frame. DCL will specify the number of data bytes for a Remote transmission request, and is disabled when sending a Data Frame.
CAN Comm
Next Steps
For more guides on how to use the Digilent Test & Measurement Device, return to the device's Resource Center, linked from Instrumentation page of this wiki.
For more information on WaveForms visit the WaveForms Reference Manual.
For technical support, please visit the Scopes and Instruments section of the Digilent Forums.