This is an old revision of the document!
Using the Data Logger (Under Construction)

This guide walks through the process of setting up WaveForms' Logger instrument and capturing some data. The user interface of the instrument is briefly described.
1. Opening the Logger
1.1
Plug in your Test & Measurement Device, then start WaveForms and make sure your device is connected.
If no device is connected to the host computer when WaveForms launches, the Device Manager will be launched. Make sure that the device is plugged in and turned on, at which point it will appear in the Device Manager's device list (1.). Click on the device in the list to select it, then click the Select button (2.) to close the Device Manager.
Note: “DEMO” devices are also listed, which allow the user to use WaveForms and create projects without a physical device.
Note: The Device Manager can be opened by clicking on the “Connected Device” button in the bottom right corner of the screen (3.), or by selecting “Device Manager” from the “Settings” menu at the top of the screen.

1.2
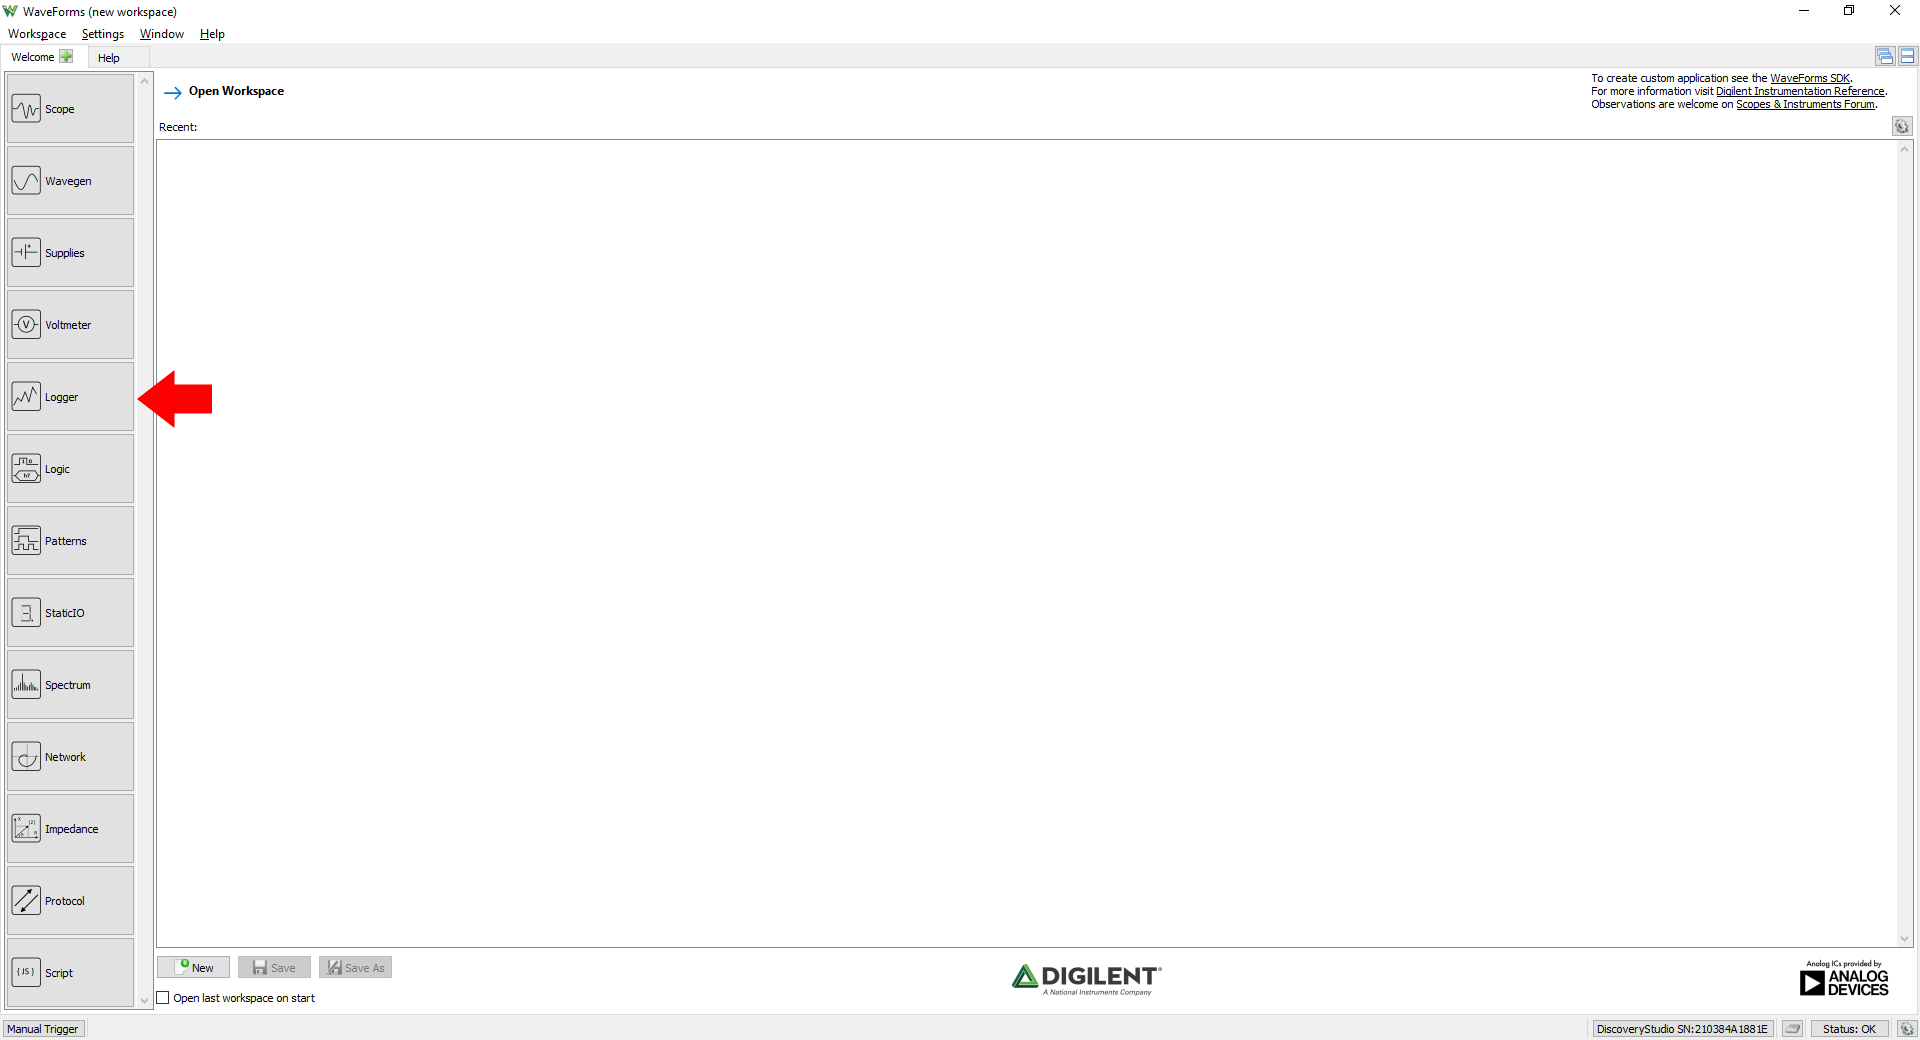
Once the Welcome page loads, in the instrument panel at the left side of the window, click on the Logger button to open the Data Logger instrument.
1.3
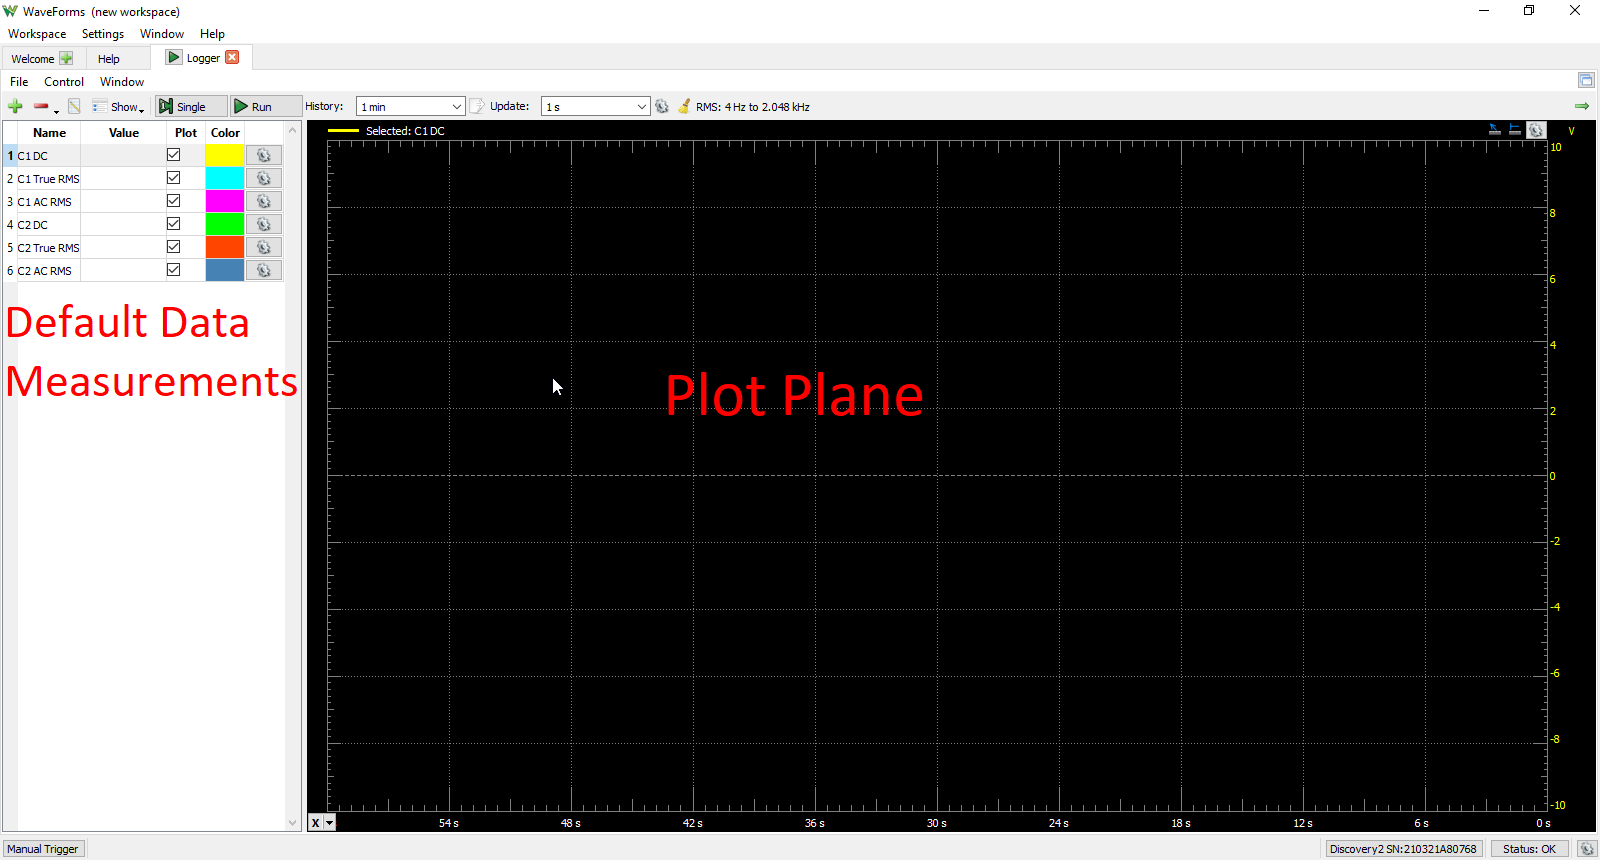
Once the Logger instrument opens, the window contains the data plot on the right side and the default data measurements listed on the left side.
2. Using the Logger
This section walks through setting up the Logger to capture data from the Scope channels.
2.1 Hardware Setup
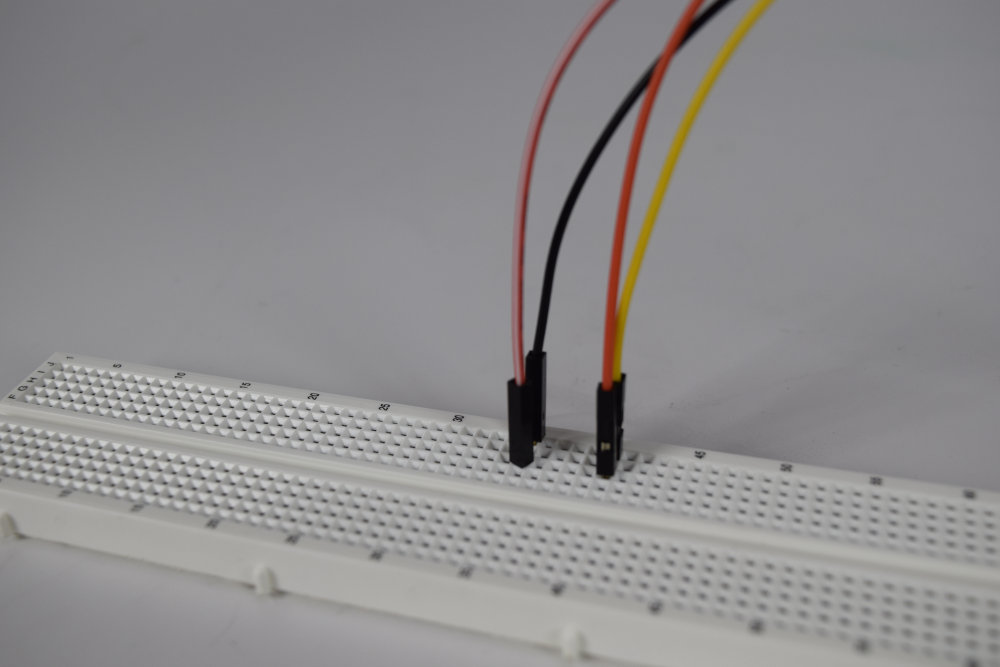
Connect the Test & Measurement Device's scope channel 1 pin (orange wire) to the device's wavegen channel 1 output pin (yellow wire). For devices that use differential input channels, such as the Analog Discovery Studio with MTE cables, make sure to connect the scope channel 1 negative pin (orange wire with white stripes) to the ground pin associated with wavegen channel 1 (black wire).
2.2 Software Setup
In WaveForms' Welcome tab, open the Wavegen instrument, then click the “Run” button ( ) in the control bar near the top of the window to begin outputting a signal. With default settings, a 1V amplitude (2V peak-to-peak) 1kHz sine wave is applied to the wavegen channel 1 output pin.
For more detail on how to use the Wavegen instrument, please see the Using the Waveform Generator guide.
Return to the Logger instrument by clicking on its tab in the bar at the top of the screen.

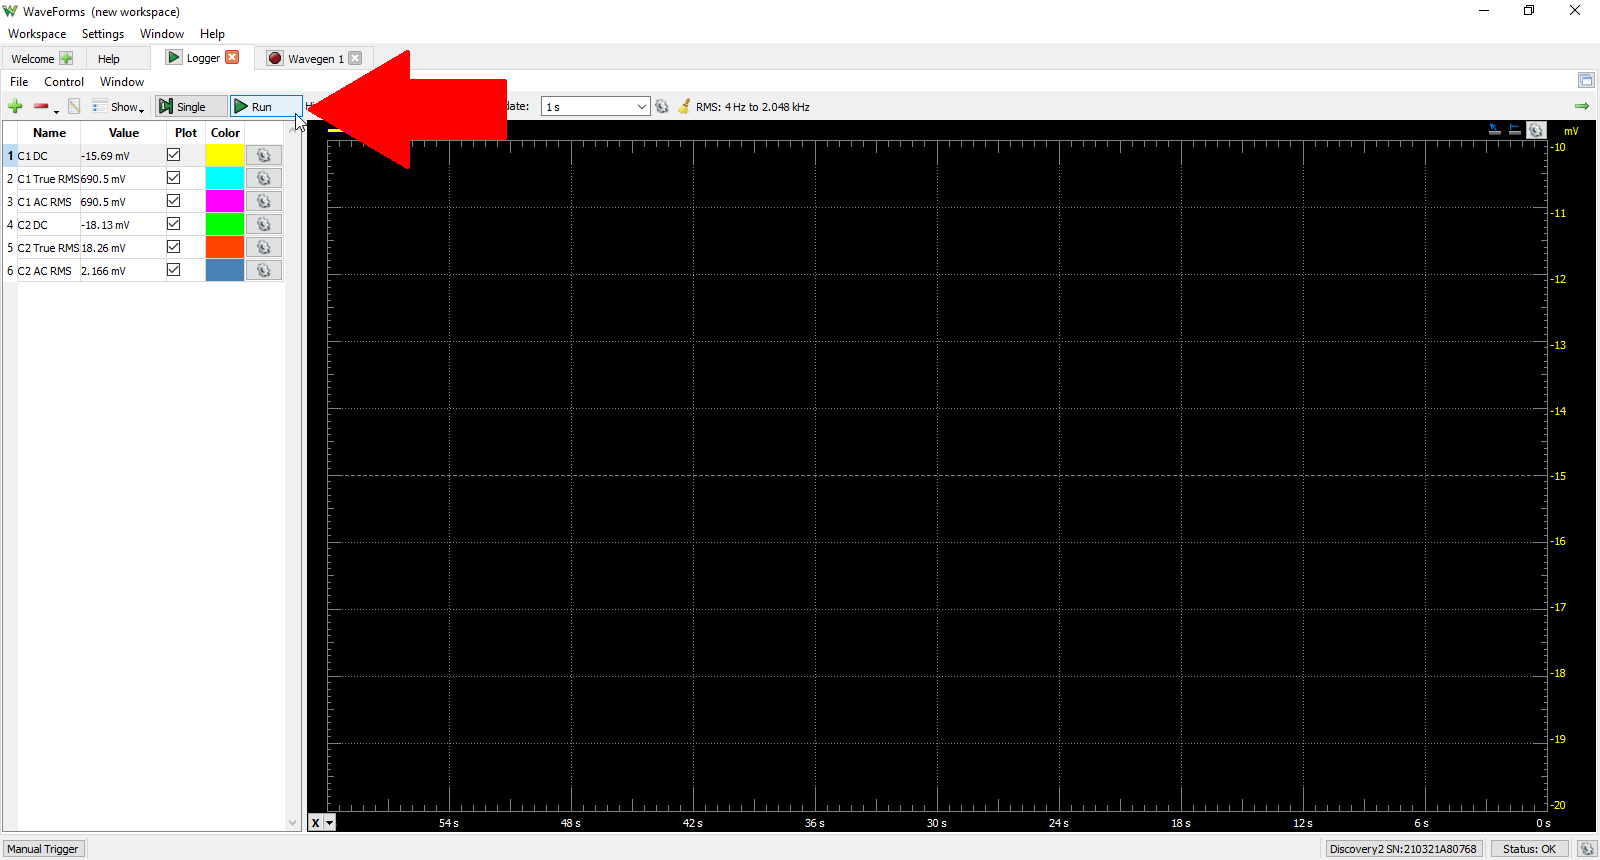
2.3 Run the Logger
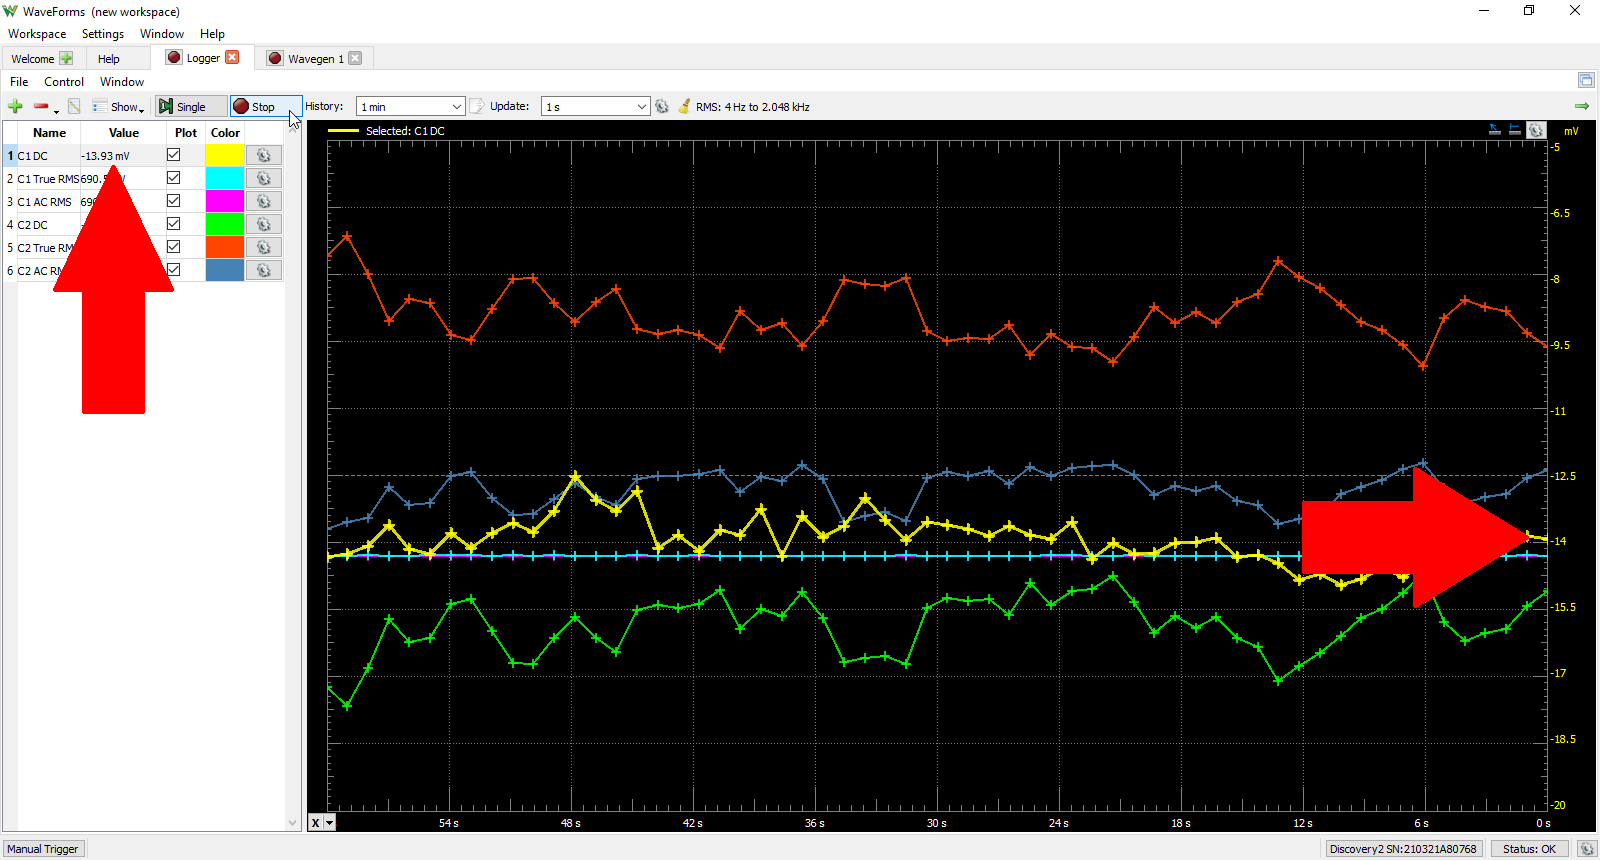
Click the Run button () button in the control bar near the top of the window to begin capturing data on the analog input channels (Scope channels). Captured data will appear in the plot pane as a set of colored lines. Each colored line corresponds to one of the default measurements listed on the left side of the window. For example: the yellow line is the measurement named C1 DC, meaning the DC voltage of the channel one input. Since the signal going into channel one is AC and centered about 0 volts, the data this measurement is collecting should be theoretically zero, but will appear as a voltage in the low mV range next to the measurement name.
2.4 Plot Plane Axes
By default, measurement 1 (named C1 DC) is selected and therefore the vertical axis will automatically display an appropriate range for viewing that particular logged signal data in the same color associated with that data (yellow for C1 DC).
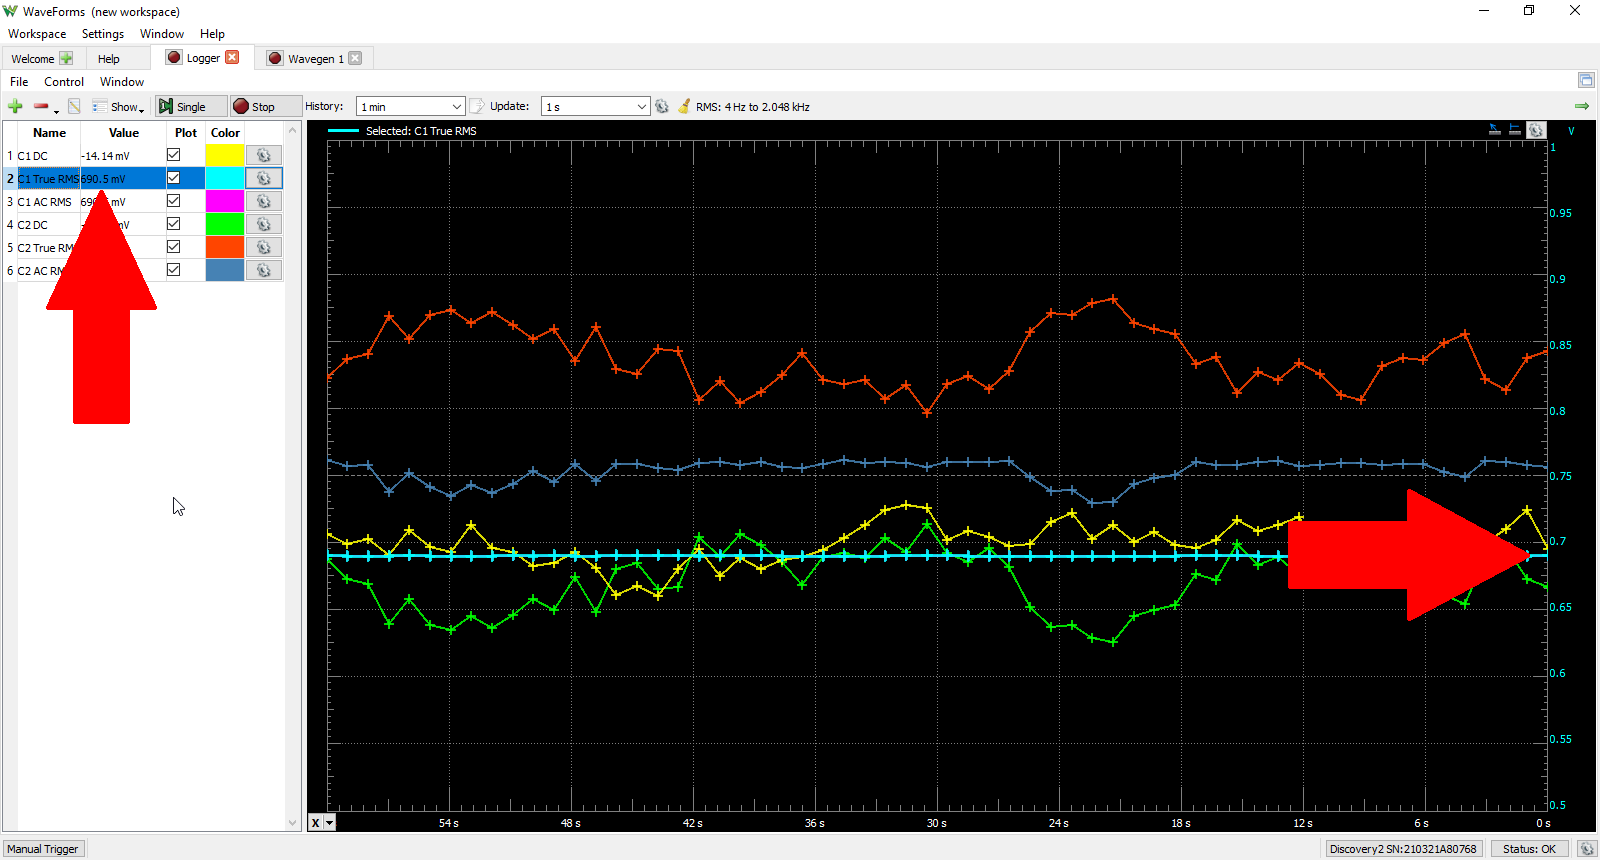
Selecting a different measurement in the list to the left of the plot plane (for example, measurement 2) will adjust the vertical axis such that the selected measurement will be displayed along with all the other desired measurements with an appropriate range for viewing the logged signal data magnitude and change its color to reflect the currently selected data (light blue for measurement 2).
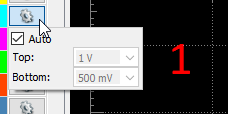
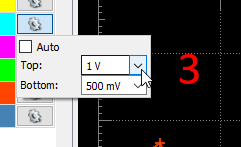
To manually set your own range for a measurement:
- Click the Utilities icon to the right of the measurement color display box
- Uncheck the Auto box
- Enter your desired Top and Bottom values

The bottom axis default is time in seconds with a minute long window where zero seconds is on the right side of the bottom axis and sixty seconds is on the left. The default sampling frequency is one second, which means that the displayed data will update once every second. Using the History drop down tab located at the top of the data plot, you can select to increase or decrease this displayed time window.

Using the Update drop down tab, you can select to increase or decrease your sampling frequency.

3. Logger User Interface Overview
This section walks through the wide variety of controls and features present in the Logger instrument.
3.1 Control Buttons
As seen in Section 2, the “control bar” near the top of the window can be used to stop and start the capturing of data from the analog input pins. In addition to the Run/Stop button, the Single button can be used to start data acquisition. In the Logger window, these buttons both start the data acquisition but a second click on the Single button will simply restart the acquisition whereas the Run button will now display Stop and a second click will stop the data acquisition. These options can also be accessed in the Control drop-down menu located above the control bar.
 image: device manager?
3.2 Data Export
To export data from the Logger tool, click the Export icon located to the right of the History drop-down menu located on the control bar. This will open a new window with two tabs titled “Data” and “Image”.
image: device manager?
The Data tab allows you to export a .csv file containing all of the current data points in the plot plane with comments, headers, and labels as default or an image of the current plot plane. You can remove comments, headers, and/or labels by unchecking the corresponding box located in the upper left section of this window.
image: device manager?
The Image tab will allow you to save an image of the Logger tool interface including the plot plane, measurements list, and the control bar with the option of displaying the device, serial number, and time that the image was taken. To change the background color of the plot for printing, see Plot Utilities in section 3.*.
image: device manager?
3.3 Measurement Maximum/Minimum Display
To the left of the Single acquisition button described in section 3.1 is a drop down menu that says “Show”. Click on this to select whether or not to add columns to display the minimum and/or maximum of all the measurements.
image: device manager?
3.4 Edit Measurement
To edit a current measurement, click once on the measurement you wish to edit such that it is highlighted, then click on the Edit icon to the left of the “Show” drop-down menu on the control bar discussed in section 3.*. This will bring up the same window used to add a measurement but with the selected measurement script, name, and unit description. See section 3.* (Add Measurements) for further information about using this tool. If no measurement is selected, the edit window will not open.
image: device manager?
3.5 Remove Measurements
The far left side of the control bar has a green “+” and a red “-” for adding and removing measurements, respectively. To remove a measurement, click on the measurement to be removed in the list. Then, click the red “-” and select remove or simply press the delete key on your keyboard. If you wish to remove all measurements at once, click the red “-” and select “Clear”. To hide a measurement from the plot plane without deleting from the measurements list, uncheck the Plot box associated with that measurement.
image: device manager?
3.6 Add Measurements (Basic)
From the control bar, click the green “+” to add a new measurement. A new window will open with two tabs that say “Item” and “Function” with the Function tab displayed by default. The Item tab contains commonly used, predefined measurements for channel 1 and channel 2: DC voltage, True RMS voltage, and RMS voltage. These are the default measurements that are displayed when opening the Logger instrument but if they were to be deleted, you can quickly add them again here.
The Function tab by default displays the script editor window where you can manually type a mathematical function or click on desired functions displayed below the Insert window to insert them into your measurement function (all trigonometric functions operate on radian values, not degrees). To hide the built in functions, uncheck the Insert box. Click the “Evaluate Script” button to check that your script functions properly. If so, a value should be displayed to the right of the button. If there is some syntaxial error “NaN” will be displayed. Below this button are fields to name your custom measurement and declare the unit of measurement. Click “Add” and your custom measurement will be added to the measurements list on the left of the plot plane with a unique color automatically applied to that measurement. Click “Close” to if you choose not to add a custom measurement and the window will close. To change the color of your measurement, click the color icon associated with your measurement in the measurements list. This will bring up a color spectrum for you to choose a new color from. Add, Remove, and Edit are measurement are also available by right clicking on the measurements list portion of the Logger tool.
image: device manager?
3.7 Add Measurements (Advanced)
Within the Function tab of Add measurements, there are two drop down menus above the script editor window. The “Script” menu will allow you to save your custom script or import a previously saved script to/from a .txt file. The “Options” menu has two options to select. The “Code Completion” option is selected by default which allows the script editor to suggest functions based on what you are currently typing in the script editor window. For example: if the Code Completion option is selected and you type an “s” in the script editor, the Code Completion will suggest all built-in functions that start with the letter “s” (i.e. square root, sine, etc.). The “Debug” option opens a new window only if there is text in the script editor window. Debug gives you an environment to step through complex scripts to ensure proper functionality, locate where your script stops functioning as desired, or identify syntaxial errors.
image: device manager?
3.8 Sampling Utilities
On the control bar, to the right of the Update drop-down menu is a Utilities icon. Click on this to show options for how each channel is sampled and displays values in the plot plane. The Samples drop down menu value is the number of samples per measurement to be displayed in the plot plane from 10 to 86400 samples. Changing this value will also update the time axis since the number of displayed samples is linked to the sampling rate of the Logger. Below the Samples drop down menu are drop-down menus for each channel to provide a DC offset of up to +/-25V; adjust the range display for each channel to either 5V, 25V or the maximum value; and/or attenuate the measurement by factors of 10.
image: device manager?
3.9 Plot Plane Cursors
To add a vertical bar cursor to the plot plane, click the Add Cursor icon in the lower left corner of the plot plane. This will add a cursor on the far right of the plot plane. To move the cursor, click and hold the cursor and drag horizontally to the time position desired. Adding additional cursors will default to a differential measurement between the first cursor position values and the newly added cursor position values. These differential cursors can be moved by clicking once on the cursor and moving to the desired position. This movement is independent of the reference cursor. If a cursor has a differential cursor referenced to it, moving the reference cursor will also move the differential cursor proportionally. Right click the cursor to display the cursor options menu. Here, you can precisely change the time position of the cursor in the position field, deallocate a differential cursor to an independent cursor or choose a reference cursor for a given cursor in the reference field, change the differential time from a reference cursor (differential cursors only), or change the color of the cursor by clicking on the color icon to produce a color spectrum to choose a color from. To remove a cursor click the Remove button at the bottom of the cursor options menu.
Additional cursor types are available by clicking either the Free or Vertical icons located in the top right corner of the plot plane. Click the Free icon once and your mouse will display the time and magnitude values of the selected measurement as you hover over the plot plane. Click on the plot plane to then place a cursor point at that position then drag your mouse horizontally and/or vertically to place a differential cursor point. Click again to replace the original cursor point and so on. Click the Free icon again to exit this cursor mode. Click the Vertical icon once and your mouse will display a vertical cursor on the plot plane at your mouse's position. Click on the plot plane to place the vertical cursor and display a differential cursor, then click again to place the differential vertical cursor. Click again to replace the original vertical cursor and so on. Click the Vertical icon again to exit this cursor mode.
image: device manager?
3.10 Plot Utilities
The Utilities Icon in the top right corner of the plot plane allows you to place text labels on your plot plane, clear those labels, change the background from dark to light (ideal for printing), and change the thickness of the plot lines. These options can alternately be accessed by right-clicking on the plot plane.
image: device manager?
3.11 Other Plot Plane Options
To clear the plot plane of all data without removing measurements, click the Clear icon located on the control bar to the right of the Sampling Utilities icon. This can be done while the Logger is running. To hide the plot plane, click the green arrow on the far right of the control bar. To redisplay the plot plane, click the green arrow again. This also can be done while the Logger is running.
image: device manager?
Next Steps
For technical support, please visit the Scopes and Instruments section of the Digilent Forums. link
More guides to using the wide variety of features included in WaveForms can be found through the resource center.
incomplete