This is an old revision of the document!
Using the Protocol Analyzer
When working on any digital logic project, communication between hardware, sensors, or main boards happens with various communication protocols. Logic analyzers can be useful when trying to discover if communication between components is working, but once you find out which component isn't working, a protocol analyzer is a must.
With a protocol analyzer, you can connect to a piece of hardware, power, and read or write to it. For example, if I have a SPI light sensor and I'm not receiving data, I can quickly check to see if the hardware is malfunctioning by connecting it and getting data. I can also quickly adjust settings to see if maybe the clock frequency or something else specified is incorrect.
The Analog Discovery 2 provides a pattern generator that can be used to test communication protocols. This is also true of the Digital Discovery, original Analog Discovery, and Electronics Explorer board.
We will go through the protocol analyzer interface, how to use it, and an example.
Inventory
-
- You may also use the Digital Disovery, Analog Discovery legacy, or the Electronics Explorer Board with WaveForms.
- A computer with USB port to run the software
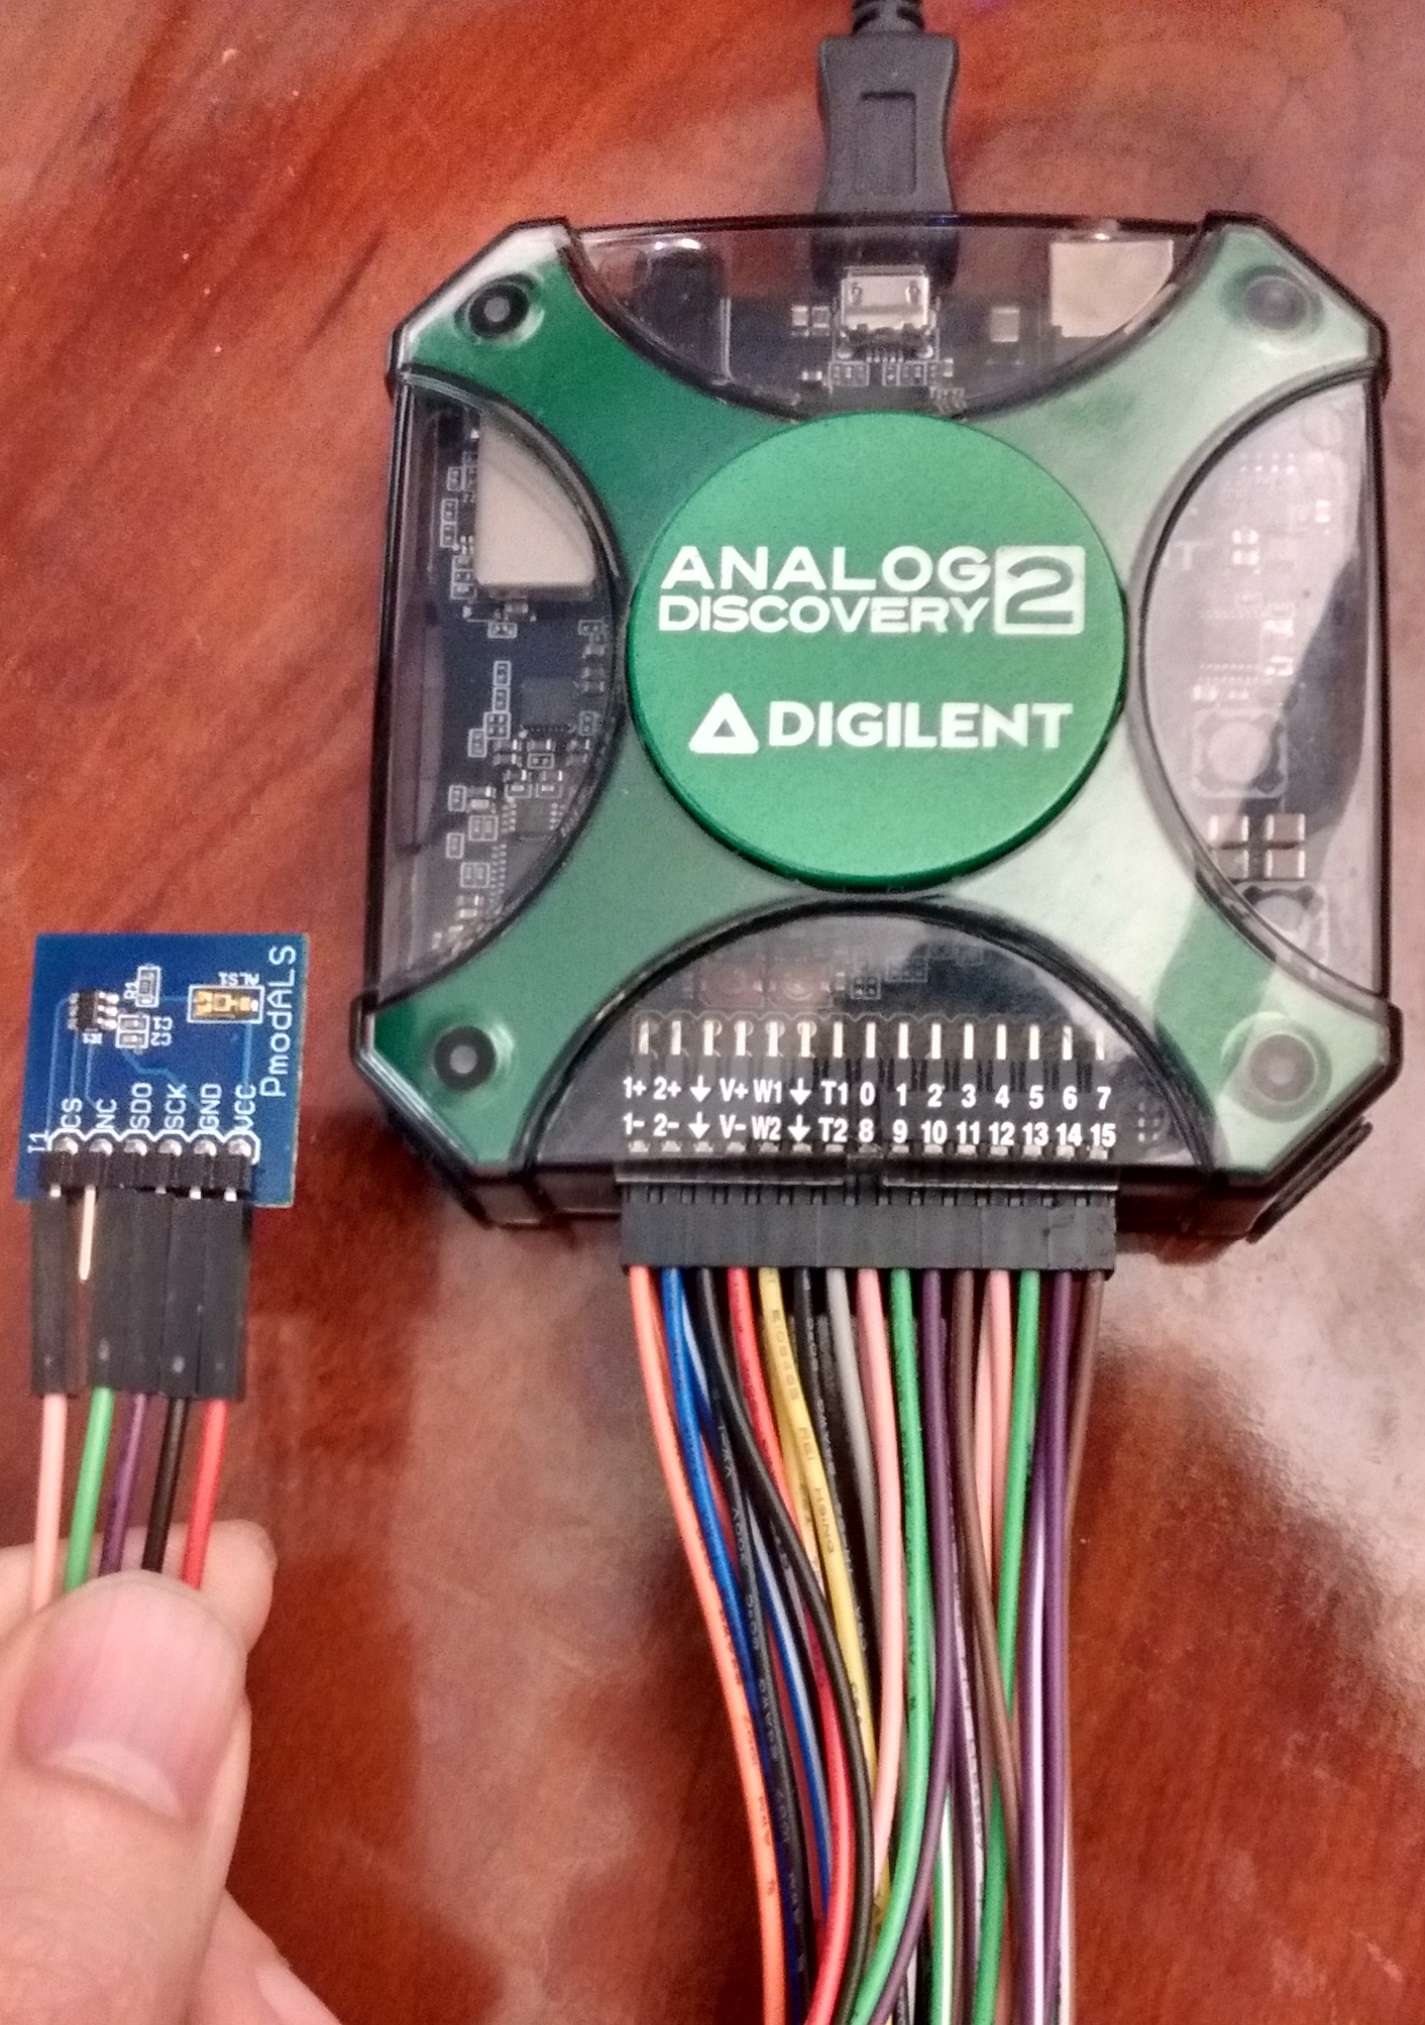
- The Pmod ALS
- This tutorial will demonstrate how to use the Protocol Analyzer with the Pmod ALS, which communicates via SPI. If you have another SPI sensor, the steps will be very similar.
Step 1: The Protocol Analyzer
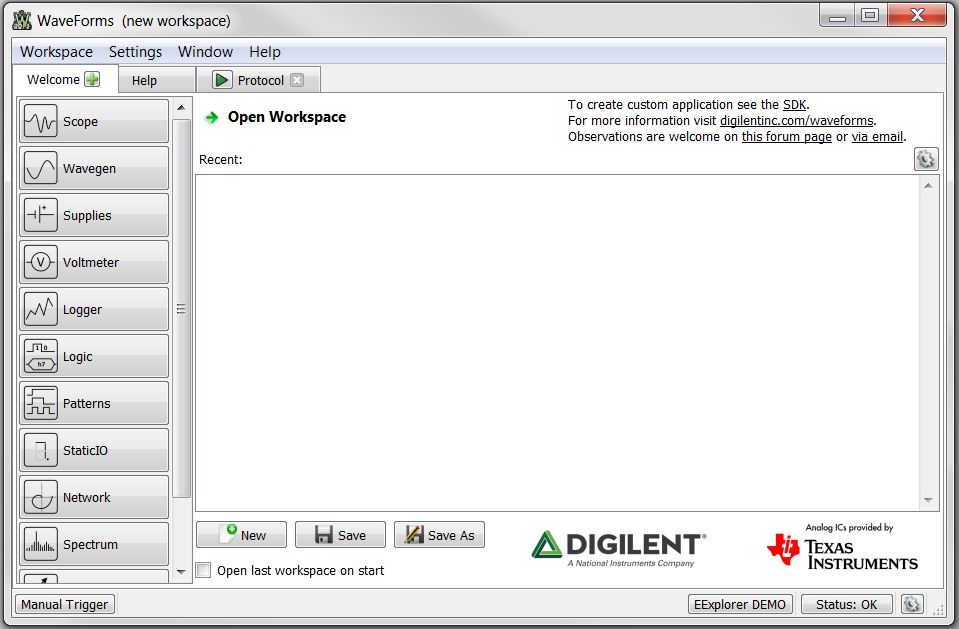
The first thing we'll do to familiarize ourselves with the protocol analyzer is take a walk around the tool. Below is an image of the main WaveForms window if you have the Analog Discovery plugged in, or you are in demo mode for the Analog Discovery 2.
On the left-hand side is a button for each of the tools. Clicking on the button labeled Protocol will open the protocol analyzer.
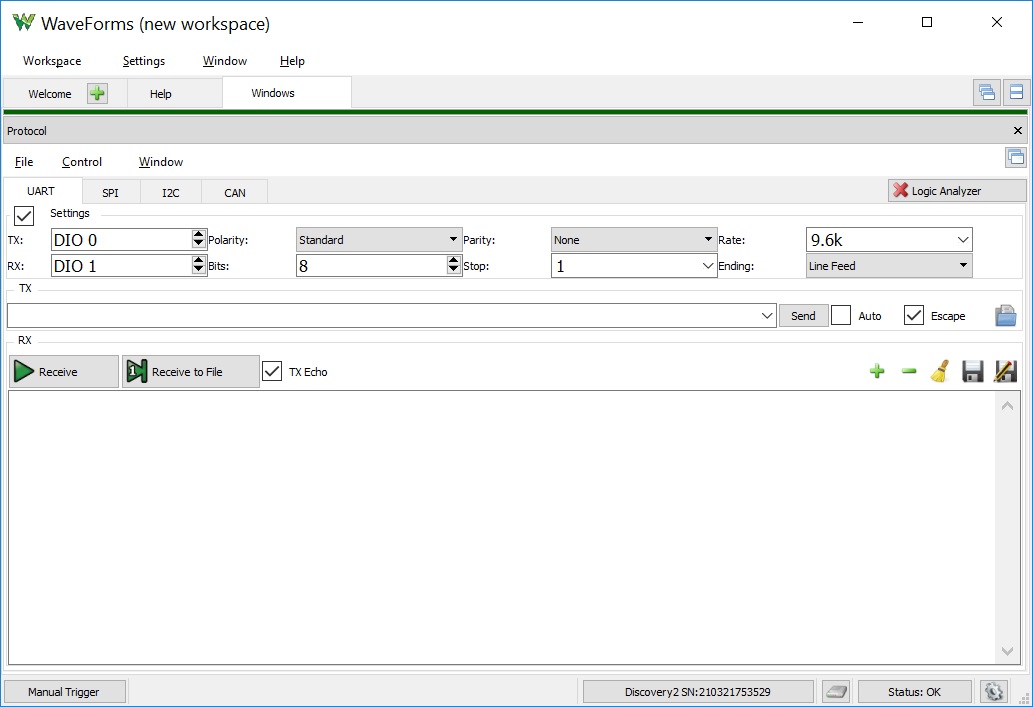
There are three main menus in the main window: File, Control, and Window.
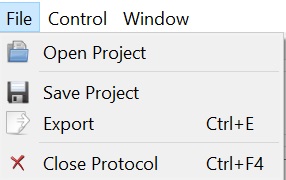
The File menu allows you to open a specific configuration of the Protocol Analyzer, save the current configuration, or close the Protocol Analyzer window. This can be especially helpful if you are working on a project and get the settings just right and need to stop and continue later, or repeat the test at a later date.
The Control menu allows you to run and stop the Protocol Analyzer. When you want to read or write a specific piece of data, you will need to make sure that the overall tool is running before you can read, write, or execute.

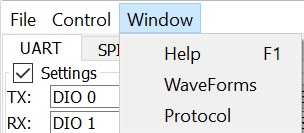
The Window menu allows you to change which WaveForms tab or window you have open. The Help tab contains information on all of the tools, menu options, and buttons. If you ever question how something works or functions, visit the Help tab. Below that, you will see whatever windows or tabs are currently open.
If you ever want to change a window to a tab, or tab to a window, you can click on the button displayed below.

The Protocol Analyzer supports the following protocols: UART, SPI, I2C and CAN. The settings and controls for these analyzers are located in the tabs below the menu bar. The following sections will detail each protocol.
UART
The UART tab allows you to send, receive, and save data over UART.
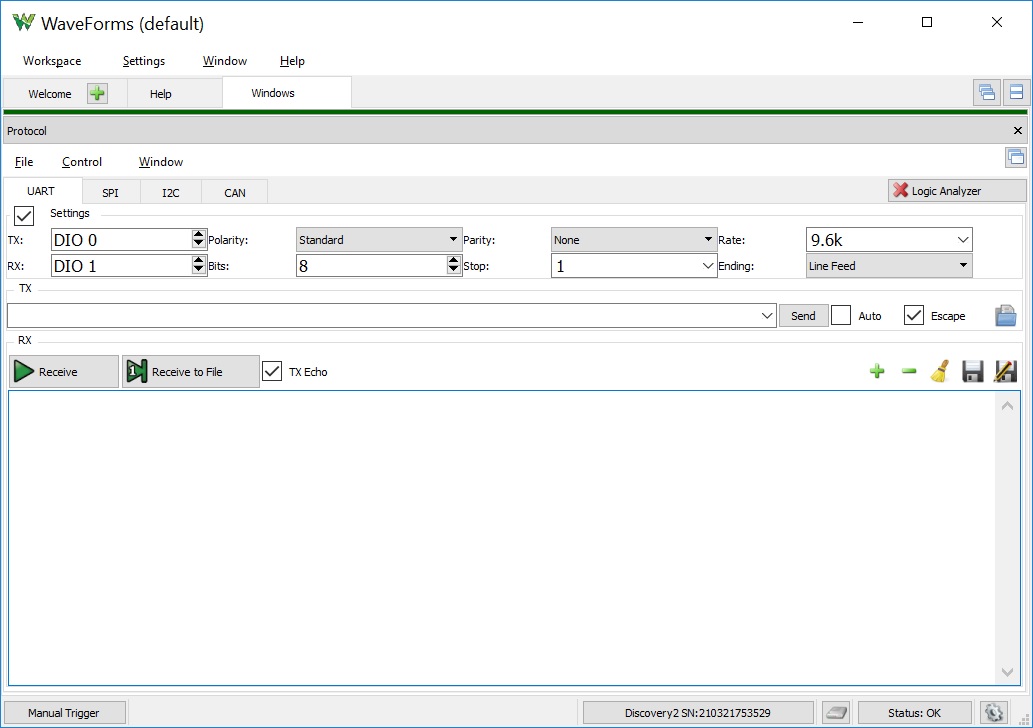
The first section on the UART tab which you can toggle open and closed is the settings section.

TX allows you to set which data line the data will be transmitted along. You can set this to any of the 16 digital I/O pins for the Analog Discovery and Digital Discovery.
RX allows you to set which data line the data will be received along. You can set this to any of the 16 digital I/O pins for the Analog Discovery and Digital Discovery, as well as any of the 24 High Speed Inputs on the Digital Discovery.
Polarity selects the signal polarity. This signal polarity can either be set to standard or inverted.
Bits selects the number of data bits and can be set to a value between 0 and 32 bits.
Parity allows you to select the parity mode. You can choose between odd, even, mark and high, and space or low parity modes.
Stop specifies the number of stop bits. You can choose a value between 0 and 3 bits.
Rate specifies the baud rate in bits per second. You can choose between 110 and 50,000,000 bits per second in standard baud rate values.
Ending selects how you'd like to end the line. You can choose between nothing, carriage return, line feed, RC LF, and LF CR.
In the TX section, you can type in the data you want to send and click send to transmit it over UART. If you check the auto box, the text is automatically sent. Alternatively, you can open a file and send that over UART.

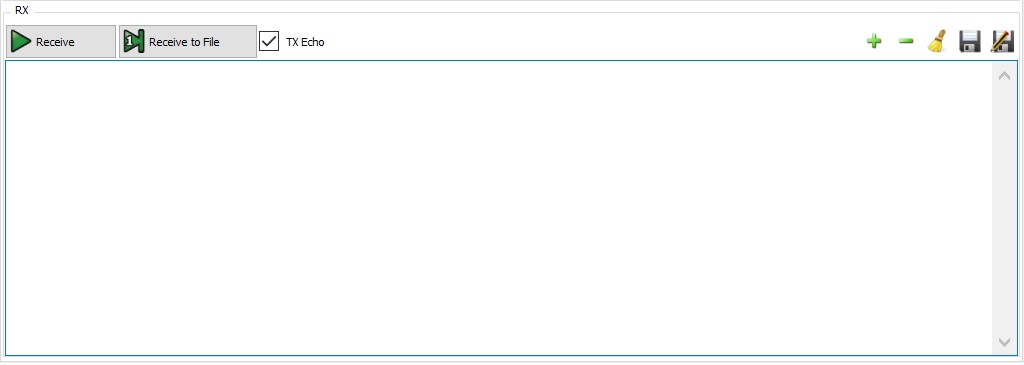
In the RX section, you can receive and save data. If you have TX Echo checked, the data that you transmit will also be received. Received data is printed in blue, sent data is printed in green, and errors will be printed in red. If there are any unprintable characters, they will appear between braces. You can also save the data using the save or append buttons. The clear button will clear all data from the RX box.
SPI
The next tab is the SPI tab, which is set up similarly to the UART tab, bit with a few more options. For now, we'll continue with the walk around. In later steps, we'll demonstrate an example using the SPI tab.

At the top of the SPI tab is the Settings box. You can hide the settings by unchecking the box next to Settings.

The Select box allows you to enter which data line you are going to use as chip select. You can choose any pin that can be configured as an output.
The Clock box allows you to enter which data line you are going to use as the SPI clock. You can choose any pin that can be configured as an output.
The Active drop-down allows you to select how the chip select signal is active, choosing between active high or active low.
The Polarity box allows you to select the polarity of the signal as either 0 and 1.
The Frequency box allows you to set the SPI clock frequency as an entered value or drop-down. You can choose any value between 1Hz and 50MHz.
The Phase box allows you to set the phase of the signal as either 0 or 1.
The next four boxes, DQ0, DQ1, DQ2, and DQ3 define the data lines. Depending on the mode that you use, these data boxes will hold different values. For example, DQ0 is used as MOSI if you are in write mode, DQ1 is MISO if you are reading. We'll get more into that later when I talk about mode.
The First Bit drop down selects the bit transmission order as Most or Least Significant word first.
The First Word drop down selects word transmission order as most or least significant word first.
The gear opens additional settings that allows you to set the initial drive of the signals.
The first way to use the SPI tab is with the Master tab. This is the tab that will likely most commonly be used.

Mode allows you to select what type of SPI operation you are doing. You can do a Read Write to DQ0 and from DQ1, Read from DQ1 as MISO, Write to DQ1 as MOSI, Read0 from DQ0 in 3-wire SPI mode, dual Read, dual Write, quad read, or quad write. More information about the modes is available in the help tab from within WaveForms.
Command Bits defines how many command bits you want to send, allowing any value up to 32 bits.
Command (DQ0) is where you enter the command word to be sent tp DQ0 before the read or write operation.
Word bits specifies the word length, which will determine how the data is displayed. Any value up to 32 bits is allowed.
Words defines how many words the data will be comprised of, again affecting how the data is displayed.
Write specifies the words that are to be sent. You can input a value in binary, decimal or hexadecimal format, or import data using the open button.
Read shows the words being read. The data can be saved to a binary or text file using the Save or Append buttons.
The second way to use the SPI tab is to use the Custom tab. This allows you to write custom scripts to combine operations into a custom SPI operation.

The following functions can be used in your custom SPI script:
- Start() activates the select signal. It will return true on success, otherwise will return false.
- Stop() Deactivates the select signal. It will return true on success, otherwise will return false.
- ReadWrite( bits per work , { word1, word2… | [word1, word2…] } ) completes a 4-wire SPI data transfer. It returns the read array of words.
- Write( bits per work , { word1, word2… | [word1, word2…] } ) completes a 3 or 4-wire SPI data write. It returns true on success, otherwise returns false.
- Read( bits per work , number of words to read) completes a 4-wire SPI data read. It returns the read array of words from DQ1.
- Read0( bits per work , number of words to read) completes a 3-wire SPI data read. It returns the read array of words from DQ0.
- WriteDual( bits per work , { word1, word2… | [word1, word2…] } ) completes a SPI data write to DQ0,1. Returns true on success, otherwise return false.
- ReadDual( bits per work , number of words to read ) completes a dual SPI data read from DQ0,1. Returns the read array of words.
- WriteQuad( bits per work , { word1, word2… | [word1, word2…] } ) completes a quad SPI data write to DQ0,1,2,3. Returns the read array of words.
- ReadQuad( bits per work , number of words to read ) completes a dual SPI data read from DQ0,1,2,3. Returns the read array of words.
- DQ#.Initial.text lets you specify the initial values.
- DIO. lets you set (the ones are not declared as SPI signal) and read the digital pins.
You can also access the SPI settings like: Select, Clock etc.
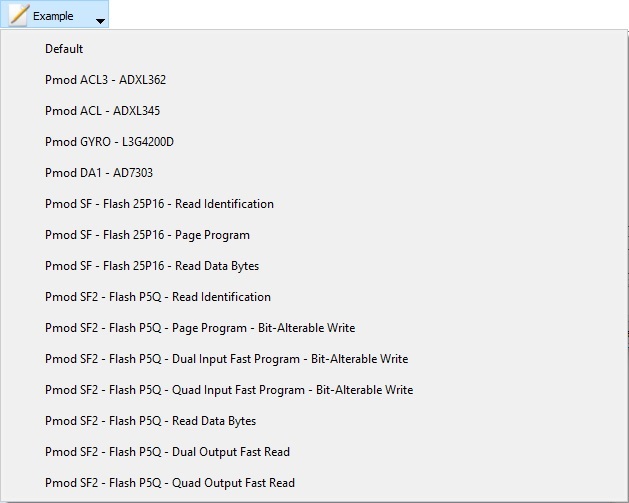
Several example scripts using Pmods are included in the Custom tab under Example.
The Sensor tab allows you to write custom communication scripts with precise timing using different functions than that of the custom tab.

The functions available are as follows:
- initialize() is called at the beginning of script execution. It is useful to initialize the device and storage files.
- loop() is called for specified number of Iterations and at specified Rate. It is useful to collect, decode and store sensor data. Use only static data transfer calls!
- finish() is called at the end of script execution. It is useful to send terminate commands to the device, and summarize measurements.
The sensor tab also provides several examples using Pmods and ICs under Example.
I2C
The final communication protocol that the Protocol Analyzer supports is I2C, which is available under the I2C tab. This tab is set up almost identical to the SPI tab.
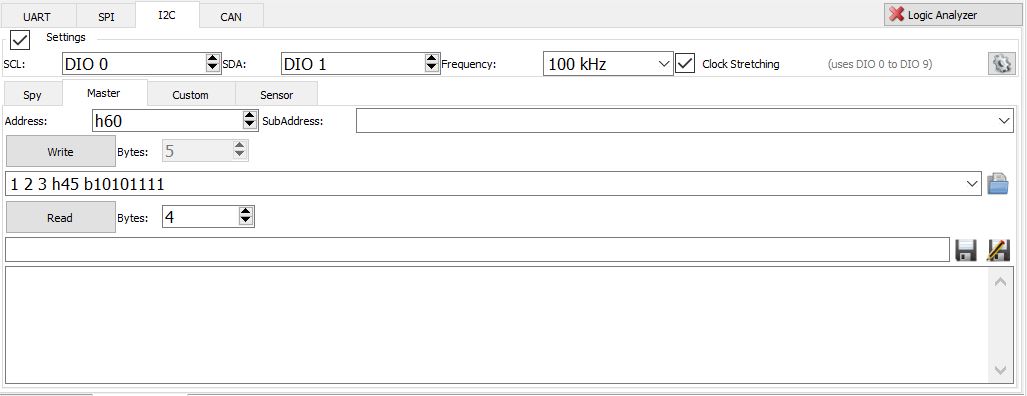
At the top of the tab is the Settings section. If you want to hide settings, you can uncheck the box next to Settings.

SCL allows you to select which pin you want to assign to the clock signal.
SDA allows you to select which pin you want to assign to the data signal.
The drop-down next to Frequency allows you to select the clock signal frequency. Any value between 1 Hz and 10MHz may be entered.
Below settings are the three tabs that allow different uses of the I2C Protocol Analyzer.
Simple is the first tab and allows you to complete basic communication with I2C.
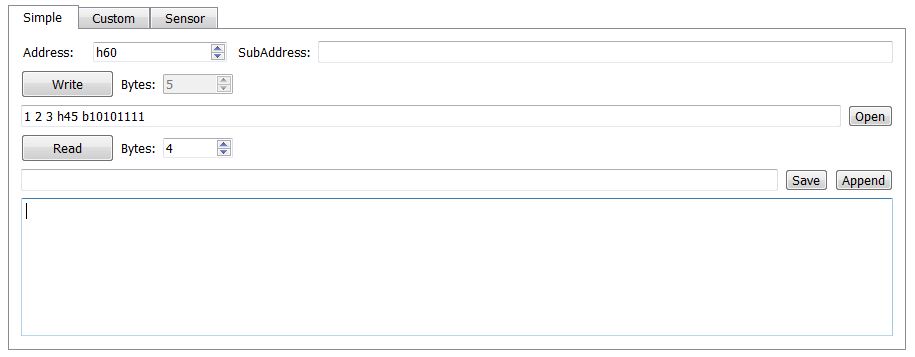
Address allows you to specify the 7 bit I2C address.
SubAddress allows you to specify the sub-address that will lead write operations and can be use to write before a read operation with restart.
Both Bytes specifies the number of data bytes to read or write.
The text box below Write allows you to specify the bytes to be written in binary decimal or hexadecimal format. You can also import data from a binary or text file using the open button.
Write executes the write function.
The text box below Read shows the read data bytes and can be saved to binary or text file using the Save or Append buttons.
Read executes the read function.
The Custom tab lets you write a custom communication script with the following functions:

- Clear() returns true when the bus is free. It will try to resolve SDA hold down issue.
- Read( address ) returns true when acknowledged otherwise false.
- Read( address, count of bytes ) returns the read bytes array from the specified address.
- Read( address, [sub address byte1, byte2…], count of bytes ) returns the read bytes array from the specified device address and subaddress using repeated start.
- Write( address ) returns true when acknowledged otherwise false.
- Write( address, [byte1, byte2… ] } ) returns zero on success or -1 on address NotAcKnowled or the NAK byte index.
- DIO. lets you set (the ones are not declared as SPI signal) and read the digital pins.
You can access the I2C settings such as SCK, SDA, Frequency, etc.
Under Example you'll find several examples using Pmods and other ICs.
The Sensor tab allows you to write communications scripts to be executed at precise timing using the following functions:

- initialize() is called at the beginning of script execution. It is useful to initialize the device and storage files.
- loop() is called for specified number of iterations and at specified Rate. It is useful to collect, decode and store sensor data. Use only static data transfer calls!
- finish() is called at the end of script execution. It is useful to send terminate commands to the device, and summarize measurements.
Step 2: Select the Correct Settings for the Pmod ALS
Now it's time for an example. We'll be using the Pmod ALS to demonstrate the Protocol Analyzer reading data via SPI.
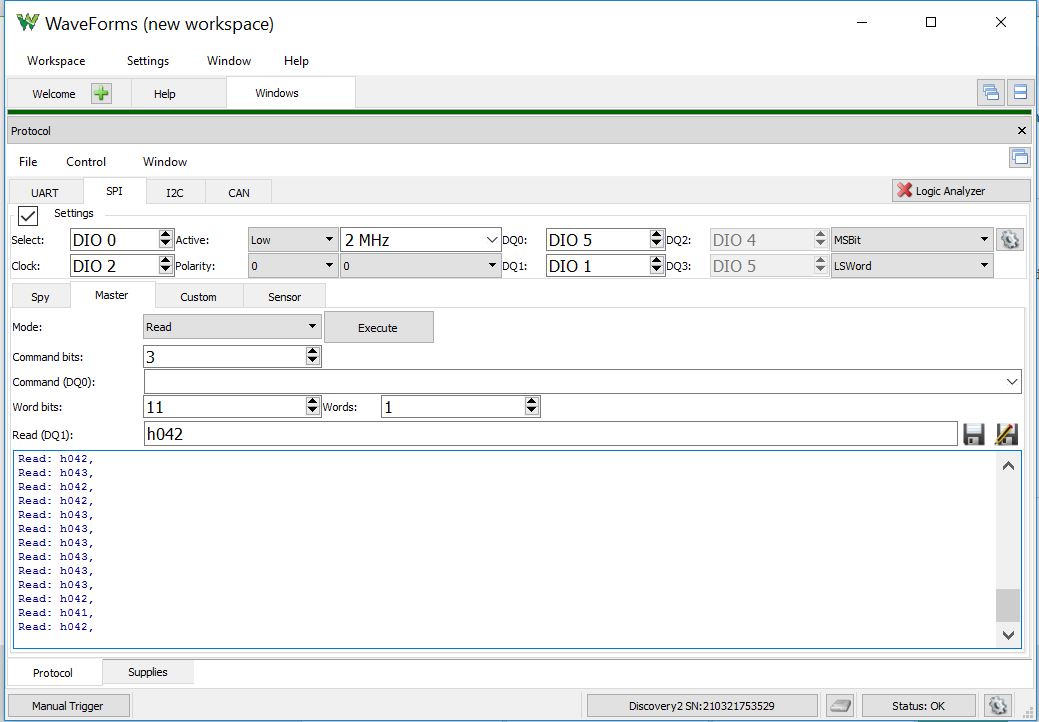
Open the Protocol Analyzer if it is not already open and enter the settings to match the image above.
Select should be set to DIO 0.
Clock should be set to DIO 2.
The clock frequency should be set to 2MHz.
DQ1 should be set to DIO1.
Mode should be set to Read.
Word bits should be set to 11.
Words should be set to 1.
Step 3: Connect the Pmod ALS to the Analog Discovery 2
Next, you'll need to connect the Pmod ALS to the Analog Discovery 2 or the Digital Discovery.
Connect the positive power supply to VCC, and set the power supply value to 3.3V.
Connect a ground wire to GND.
Connect DIO 0 to CS, DIO 1 to SDO, and DIO 2 to SCK.
Step 4: Obtain Light Level Data
Back in WaveForms in the Protocol Analyzer, click Run in the Control menu and then click Execute. Each time you click Execute, you will receive a new data value. As you increase the light, you should see the values go up, and as you decrease the light, you should see the values go down to zero.

