This is an old revision of the document!
Using the Logic Analyzer

Introduction
This guide explains the use of the Logic instrument in WaveForms. This instrument is used to capture and view digital signals on the Test & Measurement Device's digital input channels.
Prerequisites
- A Digilent Test & Measurement Device with Digital Inputs
- A Computer with WaveForms Software Installed
1. Opening the Logic Analyzer
1.1
Plug in your Test & Measurement Device, then start WaveForms and make sure your device is connected.
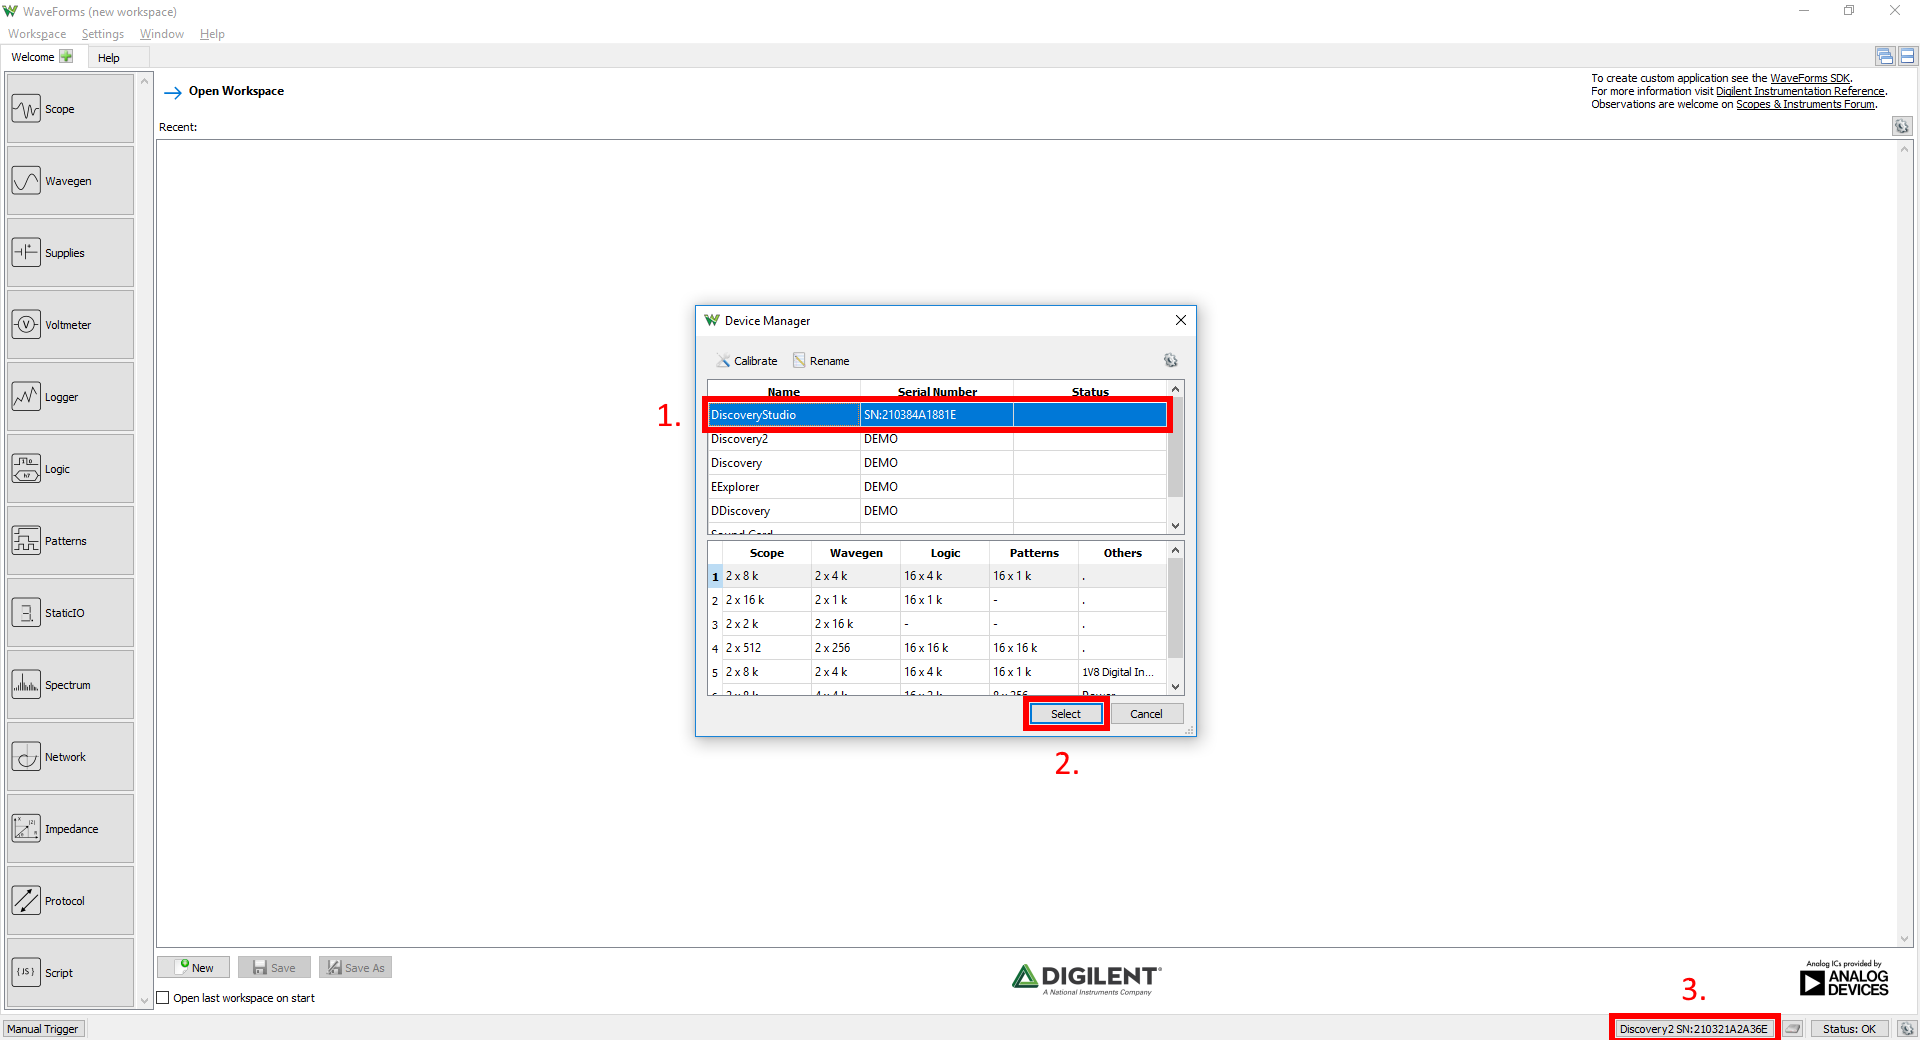
If no device is connected to the host computer when WaveForms launches, the Device Manager will be launched. Make sure that the device is plugged in and turned on, at which point it will appear in the Device Manager's device list (1.). Click on the device in the list to select it, then click the Select button (2.) to close the Device Manager.
Note: “DEMO” devices are also listed, which allow the user to use WaveForms and create projects without a physical device.
Note: The Device Manager can be reopened by clicking on the “Connected Device” button in the bottom right corner of the screen (3), or by selecting “Device Manager” from the “Settings” menu at the top of the screen.
1.2
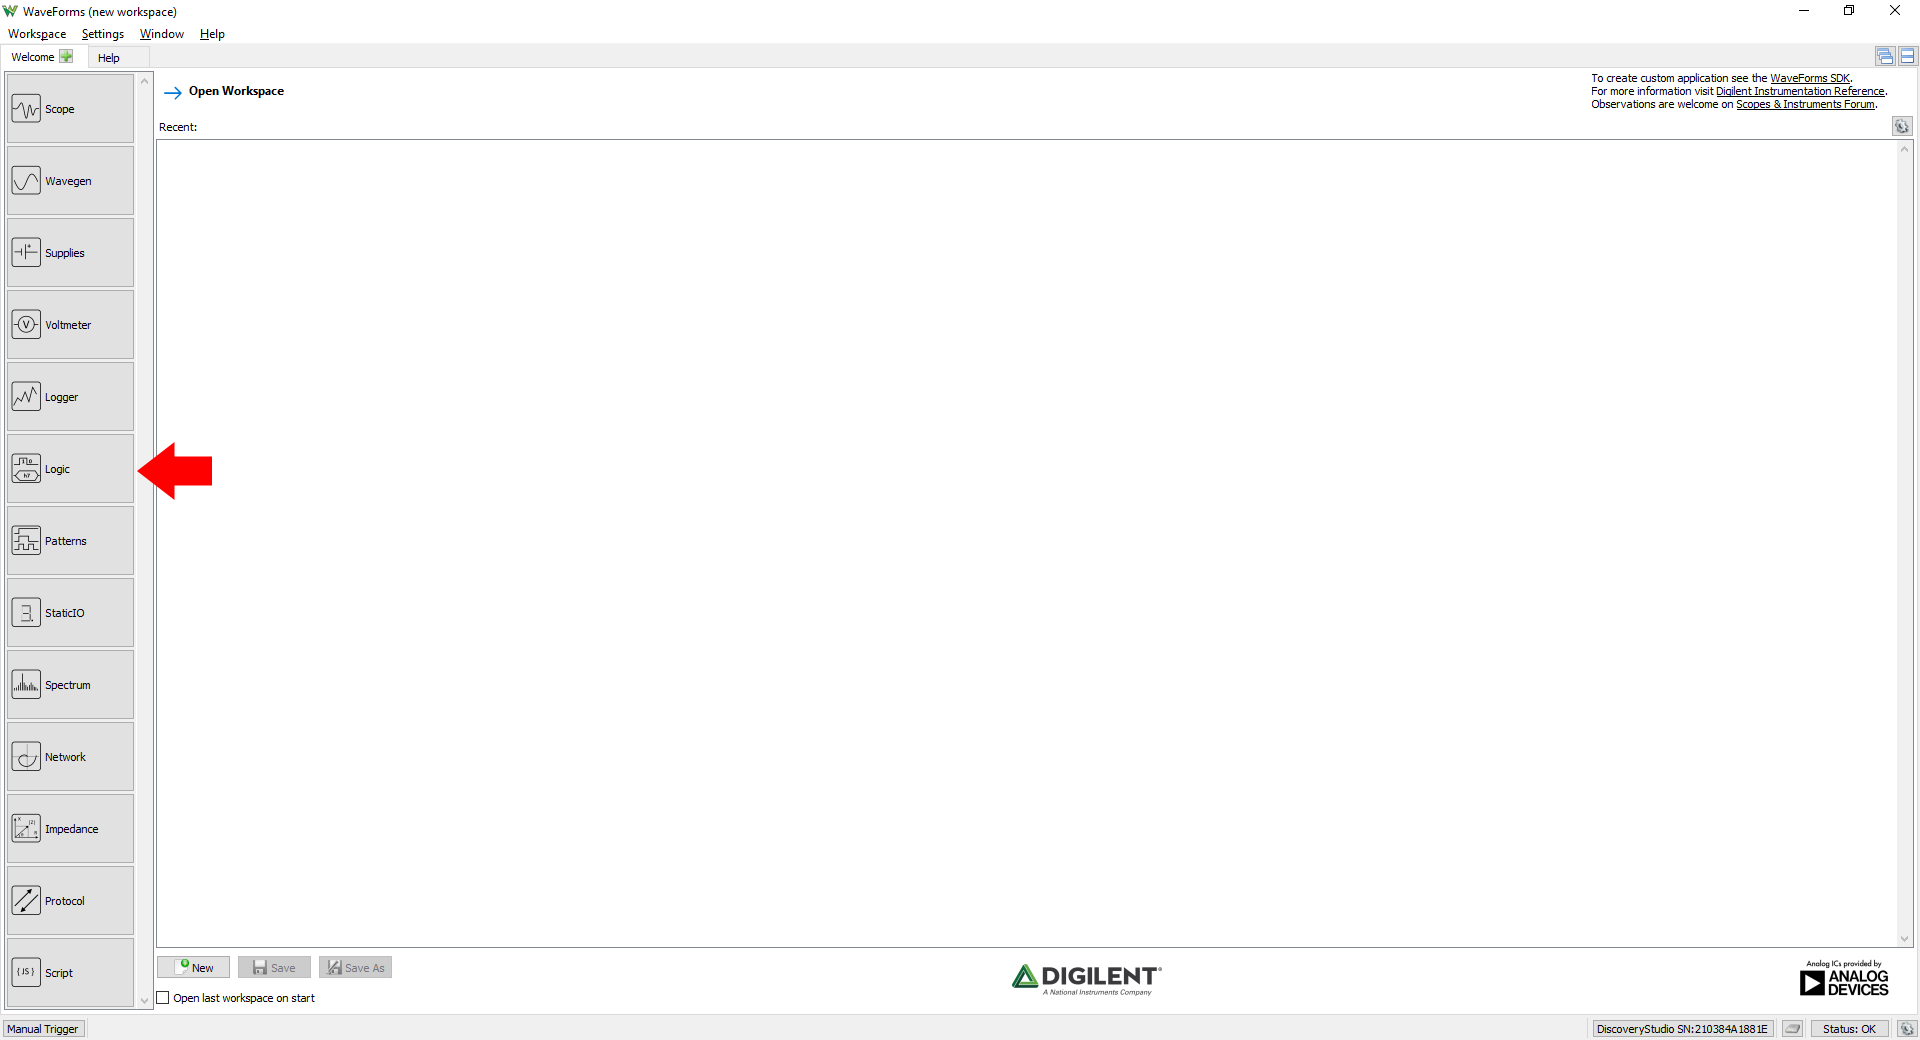
Once the Welcome page loads, in the instrument panel at the left side of the window, click on the Logic button to open the Logic Analyzer instrument.
1.3
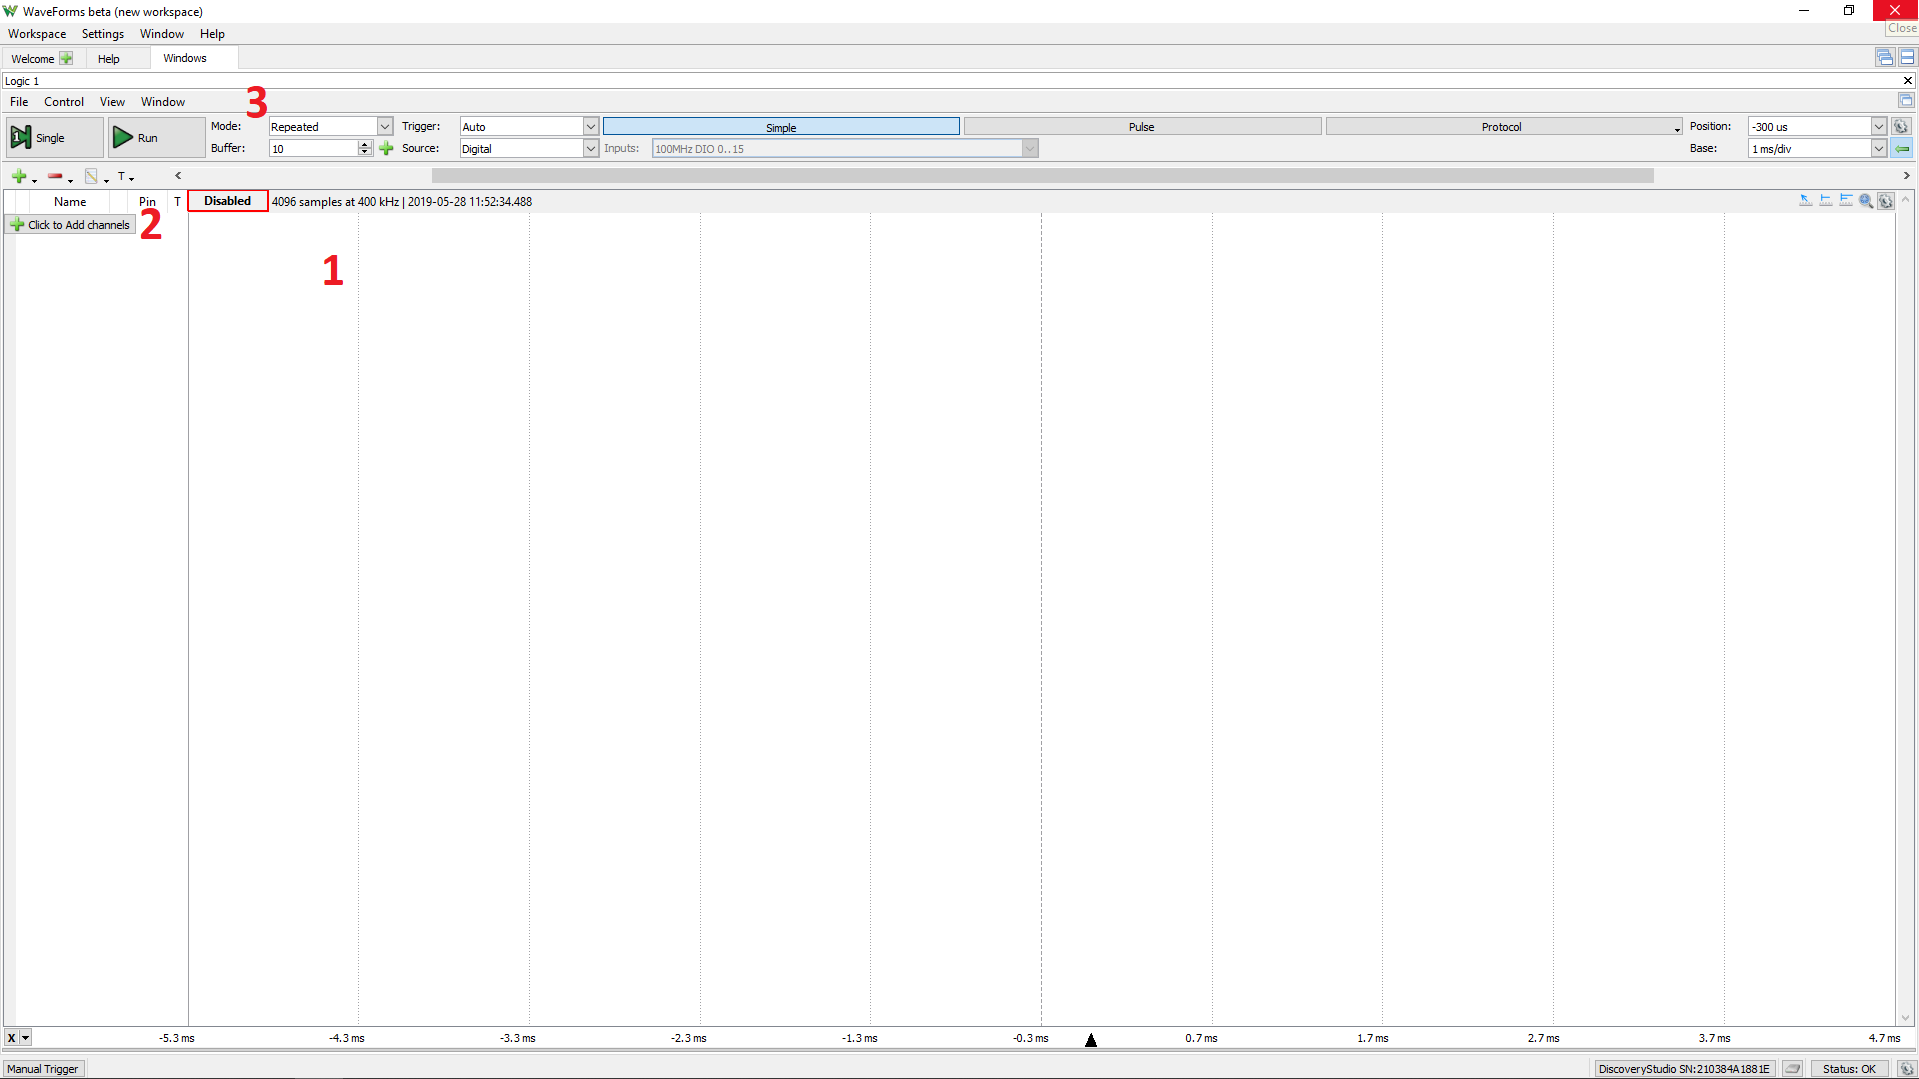
Once the Logic Analyzer instrument opens, the window contains the data plot (1) showing captured data, the configuration panel (2) to left of the plot, and the control toolbar (3) at the top of the window.
2. Using the Logic Analyzer
This section walks through setting up the Logic Analyzer to capture an incoming data signal
2.1 Software Setup
On the left panel, select the “Click to Add channels” (1 in image at right) or the green plus button ( ). The menu that pops up allows signals to be added as individual lines, a bus, a standard protocol, or a custom protocol. To add individual lines, select “Signal” (2) and use CTRL and/or SHIFT to select multiple lines. For now, select DIO 0 and click “Ok”.
To use the Logic Analyzer, some signals must be applied to the digital input/outputs used. This guide uses the Pattern Generator instrument to apply a signal to DIO 0. For a detailed tutorial on using the Pattern Generator instrument, please see the Using the Pattern Generator (Redirect) guide.
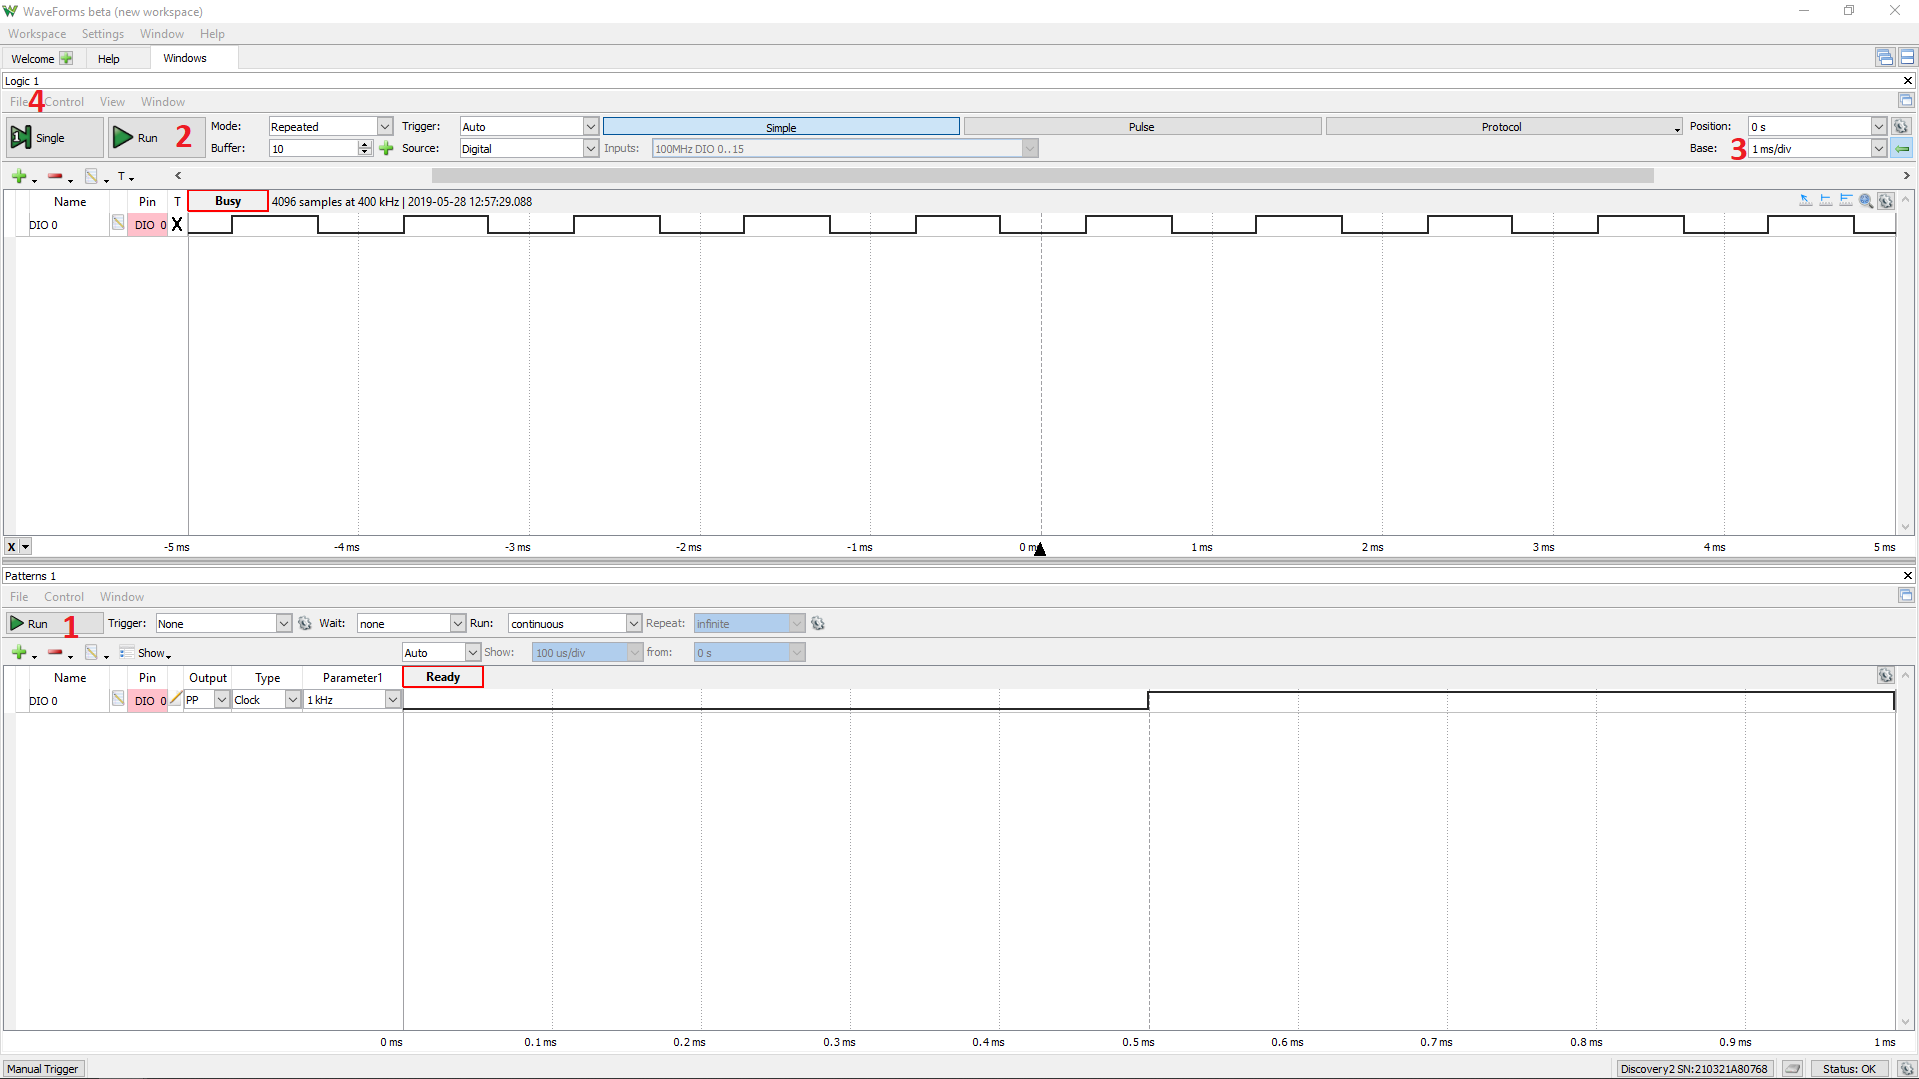
Return to WaveForms' Welcome page by clicking on its tab at the top left of the screen and select Patterns. Alternatively, press the green plus button next to “Welcome” in the tab to add the instrument (3). On the left panel, select the “Click to Add channels” button or the green plus button ( ). From “Signals” select DIO 0 and click “Ok”. Under the Type column, choose “Clock” and leave the other settings in their default state.
2.2 Capture Data
Click the Pattern Generator's Run button ( ) in the control bar (1. in the image to the right) to begin outputting the signal on digital input/output pin 0.
Return to the Logic Analyzer instrument, then click the Run button (2). The signal being generated by the Patterns instruments will appear in the plot.
Change the time scaling by selecting different value in “Base” (3), located in the top right of the instrument (see section 3.4 for more on this).
To save the captured data, select “File” (4) from the top of the window and choose either “Save Acquisition” (allows for WaveForms to reopen the instrument with the data preloaded) or “Export” (allows export of a .csv file or a screenshot).
3. Logic Analyzer User Interface Overview
This section walks through the wide variety of controls and features available in the Logic Analyzer instrument
3.1 Control Buttons
The control bar near the top of the instrument window contains two buttons used to start/stop the capture of data. The Run button continues capturing data until it is stopped. The “Single” button will fill a buffer based around a pre-defined trigger (explained in following sections). The buffer size and position relative to the trigger are set by the Position and Base options (explained in section 3.4).
3.2 Buffer Configuration
To the right of the control buttons are various options for filling the buffer and selecting which buffer to look at. Mode changes between the five acquisition modes: Repeated, Screen, Shift, Record, and Sync.
In Record mode the Logic Analyzer will repeatedly fill buffers with data and display them on the screen as they're filled until the Stop button is pressed.
Screen and Shift modes continuously add new data to the screen as it streams in instead of showing full buffers as in Record. Screen will fill the screen from left to right and then add new data on the left, overwriting the previous data set. Shift will show new data as it comes in from the right, in effect scrolling the data from right to left.
Record allows for large amounts of data to be captured at a lower sample rate. This can be used for recording data from a sensor that needs to be monitored for several minutes or hours.
Sync offers the ability to use an external clock to control when the Logic Analyzer records samples. Useful with communication protocols such as SPI, I2C, and UART.
The option Buffer allows for selection of buffers, as each acquisition fills a new one (except in Repeat mode, where buffers are sequentially filled). The green plus button ( ) creates tabs for each buffer for easy switching.
3.3 Trigger Configuration
Trigger allows for selection of the trigger type. These are None, Auto, and Normal.
None starts the acquisition immediately after Run is clicked.
Auto starts the acquisition either on the trigger event, or approximately 2 seconds after Run is pressed if the trigger event doesn't occur.
Normal starts the acquisition only on the trigger event.
The Source drop-down allows the user to trigger the oscilloscope based on events in other instruments.
The Inputs menu (at right) is available for the Digilent's Digital Discovery to specify which DIO pins to use for a specified frequency.
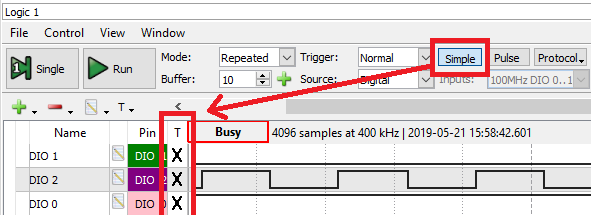
The three buttons labeled Simple, Pulse, and Protocol allow for customization of trigger conditions.
Simple is used in conjunction with the Trigger column (labeled T in the Logic instrument, see image at right). Each channel can be set to trigger on various events: Ignore ( ), Low (
 ), High (
 ), Rise (
 ), Fall (
 ), and Edge (
 ).
).
Pulse opens a menu to configure a trigger on a pulse that is either shorter than a specified time (Glitch), longer than a specified time (Timeout), the exact length of specified time (Length), or after a specified number of edges (Counter).
Protocol is used in conjunction with a Bus configuration or one of the standard protocols (SPI, I2C, UART, CAN, I2S, and 1Wire) available when adding channels to the Logic instrument. A protocol-specific menu will pop up to configure the trigger.
3.4 Time Configuration
By default, the Time group in the Configuration panel contains the Position and Base fields. The Position field centers the plot on the selected time, measured from the trigger. This can be used to view data captured before and after the trigger event. The Base field configures the scale used for the horizontal axis of the plot. Using these two settings can be thought of as “panning” and “zooming” the plot.
The gear button ( ) opens a menu (pictured on the right) that can be used to modify the Position and Base field units, and the acquisition behavior.
Position as a division toggles between units of seconds and divisions for the position.
Range Mode drop-down has the options Full, Division, and PlusMinus.
Full changes the units in Base to the full length of the buffer in seconds.
Division changes the unis in Base to the number of seconds per division (note there are always 10 divisions in the Logic instrument).
PlusMinus changes the units in Base to the number of seconds before and after the Position point.
The Clock drop-down changes between the Internal and External clocks. This option is only available for certain pieces of hardware, and therefore may be grayed out.
Noise toggles the option to acquire noise samples in half of the buffer.
The Edge drop-down allows for selection of the rising, falling, or edge for the external or internal trigger signals.
The Buffers drop-down selects the number of buffers to store in the PC. This changes the maximum value in Buffer in section 3.1.
The Clear buffers button clears all the PC buffers.
Draw while recording toggles drawing while in Record and Sync modes, somewhat resembling Scan and Screen behavior while collecting data over a long period
The Update drop-down sets the update rate of the Logic Analyzer instrument display.
3.5 Additional Configuration Options
Pressing the green arrow ( ) below the gear icon will display options for setting the number of samples to collect and sample rate. Changing these options overrides the Base selections
Samples selects the number of data points to collect.
Rate selects the sampling rate. Together with the values selected in the Samples drop-down this will determine the Base value.
3.6 Adding Protocol Channels
Protocol channels can be used to aid interpretation of digital communication protocol transactions. For example, SPI, UART, I2C, and other protocol channels can be used to represent data words in a variety of different formats (including binary, decimal, hexadecimal, ASCII, and many others). Data words are aligned with the appropriate flags (start, select, acknowledge, etc), based on user-defined settings.
In order to add a protocol channel to the plot, follow the steps in Section 2.1 of this guide and select the appropriate protocol from the list. This will cause a menu with settings specific to that protocol to pop up, allowing for selection of DIO channels for each signal line. Protocol-specific options such as endianness, polarity, bit order, etc can also be defined.
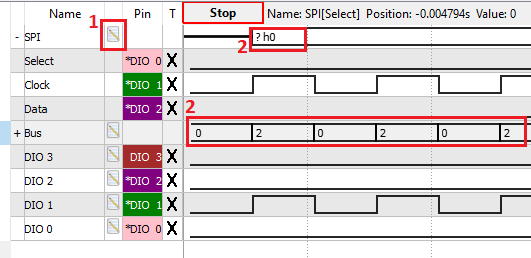
After being added to the plot, protocol channel settings can be modified by clicking the Properties icon for that channel (1 in the image at right).
The Protocol and Bus modes will display the data seen on each individual line, as well as the overall value of that combination of channels. These values are marked by 2's in the image at right.
3.7 View Options
The View menu is located at the top of the Logic Analyzer instrument window, right above Run. Selecting any of the views in that menu will open a tabbed window on the right side of the instrument window. The available views are Data, Events, Logging, Measurements, Cursors, and Notes (see image at right).
Data displays a table of all acquired samples. If using the Bus or a protocol, only the overall values (as discussed in 3.5) are displayed.
Events only displays data when it changes. This provides a more compact view than Data, but only displays one channel at a time. Channels can be selected in the drop-down presented at the top of the Events view, as well as filtered by various methods.
Measurements shows the list of selected measurements. These available measurements are cycles, frequency, period, positive/negative duty cycles, and positive/negative pulse widths.
Logginguses scripts to customize saving methods of data.
Cursors are used to measure data about the waveform detected in the instrument. The drop-down menus contain adjustment controls for the position, reference cursor, and delta x value.
Notes allows for adding of notes and descriptions into projects.
Next Steps
For more guides on how to use the Digilent Test & Measurement Device, return to the device's Resource Center, linked from Instrumentation page of this wiki.
For more information on WaveForms visit the WaveForms Reference Manual.
For technical support, please visit the Scopes and Instruments section of the Digilent Forums.

