Unit 6: Analog I/O and Process Control
Unit 6 Labs
Download This Document
1. Introduction
The purpose of this laboratory exercise is to investigate applications of embedded controllers to real time control algorithms that employ analog inputs and analog outputs. You will use a computer algorithm to implement a closed-loop processor fro motor speed control. You will see how feedback can be used to linearize an inherently nonlinear process and result in zero steady state control error.
2. Objectives
- Generate PWM outputs to implement variable motor supply voltage.
- Implement a tachometer operation using PIC32 Timers.
- Develop MPLAB X projects that implement open-loop and closed-loop motor control.
- Develop the C program code to implement a PI controller and a moving average digital filter.
- Manage multiple background tasks in an interrupt driven system.
- To monitor and display data from a process running in real-time.
3. Basic Knowledge
- Suggested reading: Embedded Computing and Mechatronics with the PIC32 Microcontroller
- Basic circuit theory
- Fundamentals of programming with C
- How to configure I/O pins on a Microchip® PIC32 PPS microprocessor
- How to implement a real-time system using preemptive foreground – background task control
- How to generate a PWM output with the PIC32 processor
- How to configure the Analog Discovery to display logic traces
- How to implement the design process for embedded processor based systems
4. Equipment List
4.1. Hardware
- Workstation computer running Windows 10 or higher, MAC OS, or Linux
In addition, we suggest the following instruments:
4.2. Software
The following programs must be installed on your development workstation:
- WaveForms (if using the Analog Discovery 2)
- Spreadsheet application (such as Microsoft Excel)
5. Project Takeaways
- How to read analog voltage with a PIC32 processor.
- How to use the PIC32 Output Compare to implement a PWM analog output.
- How to use the PIC32 Input Capture period measurement to implement a tachometer.
- The advantages of using period measurements as opposed to frequency measurements and vice versa.
- Fundamental digital filtering concepts for data smoothing.
- Open-loop and closed-loop process control.
6. Fundamental Concepts
This unit introduces the concepts of process control of electro-mechanical systems that employ analog and digital I/O. Reference 1 is the suggested companion reference and certain sections will be noted throughout this unit as well as labs 6a and 6b. Be advised that this reference is based on the PIC32MX750 processor and not the PIC32MX370 processor used on the Basys MX3 trainer board. This reference also uses a different hardware platform for the software examples. The significant differences between these two processors are discussed in Appendix C of this suggested reference book.
6.1. Process Control
Automated process control is an engineering discipline that deals with architectures, mechanisms and algorithms for maintaining the output of a specific process within a desired range. In general, automation is the control of equipment and systems that require minimum human interaction. Figure 6.1 is a block diagram representing the main elements in microprocessor based automated system that could be used to implement an automobile speed control. Although there are various forms of control theory, Reference 2 describes two forms of control: open-loop and closed-loop.
The block diagram of Fig. 6.1 has partitioned the automated process into elements of hardware and software that will be described in detail below. The elements shown inside the shaded blue box are implemented using software within the microprocessor. The elements shown inside the shaded green boxes are parts needed for open loop control processing. The elements shown inside the shaded orange boxes are parts that are not required for open loop but provide instrumentation to monitor the performance of the open loop system. The shaded yellow box element is added to the open loop control and instrumentation elements to form a completed closed loop system. The input signals that are continuous in nature must be converted from analog to digital by using an analog-to-digital converter (ADC). Output signals that are used to control mechanical and thermal devices such as motors, heaters, and air conditioners require the digital variable to be converted to an analog signal using a digital-to-analog converter (DAC). Both the ADC and DAC will be discussed in detail to follow.
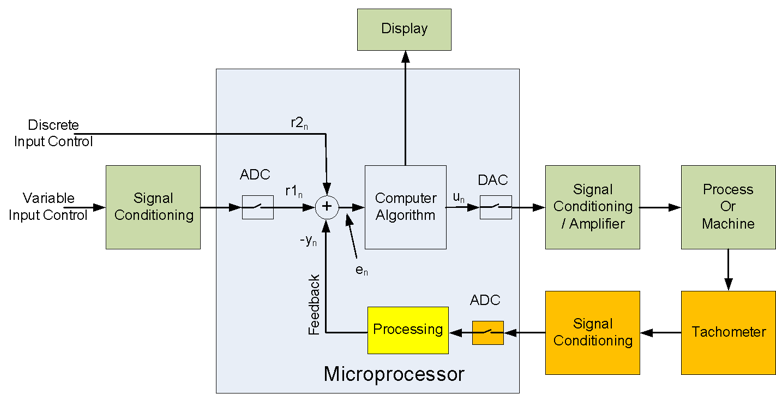 Figure 6.1. Automated process control block diagram.
6.1.1. Open-loop Control
Open-loop control of a system results when there is no feedback from the system output back into the control algorithm. In other words, an open-loop controller does not determine if the processor is generating the desired output, given the system inputs, because the system does not observe the output of the processes that it is controlling. Consequently, a true open-loop system cannot correct any errors or compensate for disturbances to the system.1) The signal path from input to output is called feed forward, as the output is some closed form function of the input signal or signals. For example, using the open loop automobile speed control, the gas flow to the engine is controlled by the position of the accelerator but the vehicle ground speed is not necessarily directly related to the accelerator position. The driver must manually adjust the gas flow so the vehicle travels at the desired speed. If the inclination of the road changes up or down, the driver must make adjustments in the accelerator position to maintain a constant speed, in part by watching the speedometer.
6.1.2. Closed-loop Control
Closed-loop control requires information relating the actual operation of the device under control back to the process algorithm.2) A classic example is the automobile cruise control. As the vehicle’s speed changes due to changes in road inclination, the position of the accelerator is automatically adjusted to maintain the set speed. Later model automobiles also have adaptive speed control to maintain speed when going down hills and approaching slower moving vehicles. It will be shown that the speed control of the DC electric motor is modeled by the block diagram shown Fig. 6.1.
6.2. Signal Processing
Signal processing is an enabling technology that encompasses the fundamental theory, applications, algorithms, and implementations of processing or transferring information contained in many different physical, symbolic, or abstract formats, broadly designated as signals. In this unit, we will employ both analog and digital signal processing. Analog signal processing will be used to implement frequency filters for both microprocessor inputs and outputs. The analog filters are an electronic circuit operating on continuous-time analog signals. Digital filters use computers and microprocessors to perform mathematical operations on sampled, discrete-time signals to reduce or enhance certain aspects of that signal. We will look at how both analog and digital filters are used in digital open and closed-loop control. It will become apparent in Lab 6b that the timing for sampling the inputs and generating the output must occur at fixed intervals.
6.2.1. Analog Signal Processing
Analog signal processing is any type of signal processing conducted on continuous analog signals by some analog means, usually involving electronic circuits consisting of resistors, capacitors, inductors, and high gain differential amplifiers. The term “analog” refers to signals or information that is continuously variable. Mathematically, this implies that the signal can be differentiated an infinite number of times.
Electronic analog computers are able to process analog signals using electronic operational amplifiers that implement the basic mathematical operations such as add, subtract, multiply, and divide transcendental functions such a logarithms and exponentials, as well as integral and differential calculus. Programming analog computers is tantamount to wiring electronic circuits, making them difficult to construct and modify. Although microprocessors have replaced most of the analog computers, they are still frequently used to implement electronic filters for signal conditioning of digital computer inputs and outputs. Analog filters do have the advantage of being able to operate at higher power levels and frequencies.
6.2.2. Digital Signal Processing
Digital signal processing (DSP) is the use of digital computers to implement digital processing to perform a wide variety of signal processing operations. The signals processed in this manner are a sequence of numbers that represent samples of a continuous variable in a domain such as time, space, or frequency.
Digital computers, particularly in the form of microprocessors, have replaced the computing effort that was formerly allocated to many analog computers. Digital computers cannot directly process analog input signals without first converting the signal into representations of the signal as discretely varying levels using an analog-to-digital converter (ADC). Digital computers can generate discretely varying output using a digital-to-analog converter (DAC), but to get truly continuous output, the DAC output must be further filtered using an analog filter. In the course of this Unit, you will discover there are different approaches to implementing an ADC and DAC.
7. Background Information
7.1. Motor Controls and Feedback
The details of the elements of the control system illustrated in Fig. 6.1 will be presented in the following sections, starting with those outside the microprocessor, namely reference inputs and feedback from the motor. Then the analog output from the processor into the motor will be addressed. Finally, the role of the microprocessor used for open-loop and closed-loop control will be presented.
Figure 6.1 shows that there are two analog-to-digital converters (ADC) in the closed loop system that we will be implementing. One is used to read a variable reference that sets the motor speed. A second is used to read the motor speed tachometer. When working with time varying signals we will need to resolve the conflict between the measurement of frequency and the frequency of measurement, and the effects of noise on the quality of the measurements. We will look at different ways of implementing ADCs to measure an AC tachometer signal.
7.2. Variable Speed Control
The Analog Control Input on the Basys MX3 processor board will be used as the variable input control. Figure 7.1 shows that the potentiometer is connected to PORT B pin 2 of the PIC32MX370. To use the PIC32 analog input connected to the potentiometer, we will need to assign RB2 as an analog input and then read the analog channel on a periodic basis. Analog channel 2 (AN2) is assigned to read the analog input on RB2. The ADC value of AN2 will vary from 0 to 1023 when the potentiometer output is varied from 0 to 3.3VDC. Initializing the ADC10 is not a trivial matter and following examples is the best approach rather than starting by attempting to unravel the data sheets.3) The ADC10 example in the Microchip PIC32 Peripheral Library of the MPLAB X Help can be used as a reference for developing the code to read one or more ADC channels.
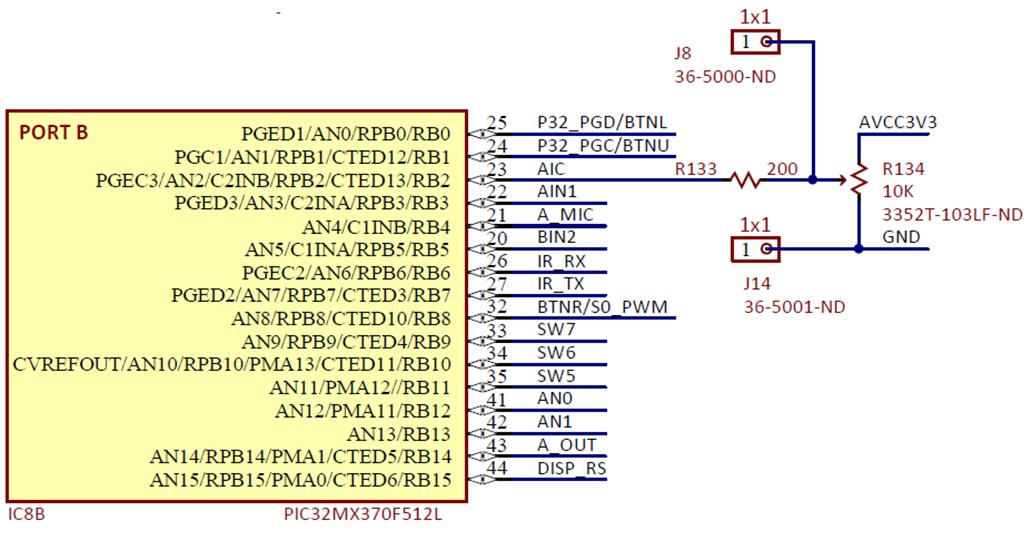 Figure 7.1. Analog Input Control schematic diagram.
Considering that the PIC32 ADC is connected to a potentiometer under manual control, the speed at which the analog voltage can change is relatively low. In Lab 6a and 6b we will run the PIC32 ADC at a high rate of speed so that the most recent ADC conversion will accurately reflect the current potentiometer setting. As Fig. 7.2 illustrates, the process of completing a single conversion consists of two phases: the sample phase and the conversion phase. The parameter $T_{AD}$ is the period on the ADC clock that can be an internal RC oscillator or the peripheral bus clock. From Fig. 7.1, we see that the input resistance is 10K ohms. According to the PIC32MX370 data sheet, the minimum $T_{AD}$ is 65 ns when the input resistance is 500 ohms. We will compensate for the elevated input resistance by extending the conversion time. Using a peripheral bus clock of 10 MHz, $T_{AD}$ is 100 ns and requires the minimum sample interval of 2 $T_{AD}$. Longer sample intervals result in more accurate conversions. If we set the sample rate to 250 KHz, then the conversion time, $T_C$, will be 4 µs, or 40 $T_{AD}$ clock cycles. TC is the sum of the conversion time and sample time as expressed by Eq. 7.1.
$$T_C = T_{CONV} + T_{SAMP} = 4 \mu s = 40 \cdot T_{AD} \qquad (Eq. 7.1)$$
Since the conversion time always requires 12 $T_{AD}$ clock cycles, the sample time is 2.8 µs, or 28 clock cycles, as expressed by Eq. 7.2.
$$T_{SAMP} = T_C - T_{CONV} = 2.8 \mu s = 28 \cdot T_{AD} \qquad (Eq. 7.2)$$
Configuring the PIC32 ADC to start a new conversion as soon as the last one is completed gives us the 250 kHz sample rate. In Lab 6a, the required conversion rate is 4 Hz, which is dictated by the background loop rate. The conversion rate for Lab 6b is 1 kHz. Since both of these rates are far less than the rate at which the ADC is converting the analog inputs to digital values, we can simply read the ADC whenever a new result is needed.
 Figure 7.2. ADC10 conversion timing.
7.2.1. Feedback: Digital Tachometers
Tachometers indicate the speed of rotating machinery such as generators and motors. There are two basic types of tachometer sensors: digital and analog. Digital tachometers are usually based on either optical or magnetic sensors that require either a reflective surface or a magnetic element to be mounted on the motor shaft. The output of digital tachometers is a signal whose frequency is linearly dependent on the motor shaft speed of rotation. Analog tachometers are essentially an alternator (or AC generator) that is mechanically link to the motor shaft. Both the amplitude and frequency of the alternator output is linearly dependent.
The DC motor shown in Fig. 7.3 will be used for Lab 6a and 6b and uses a motor that has a magnet attached to the motor shaft. There are two Hall-effect sensors positioned orthogonally on the circuit board at one end of the motor. Each time magnetism of the magnet attached to the rotor changes poles, the resistance of the Hall-effect sensor changes from low to high. Hence when the motor is running, each Hall-effect sensor generates a square wave offset by a quarter of a wave. Hall-effect sensors require a pull-up resistor to generate electric signals. This pull-up resistor will be provided by a resistor that is internal to the PIC32 processor.
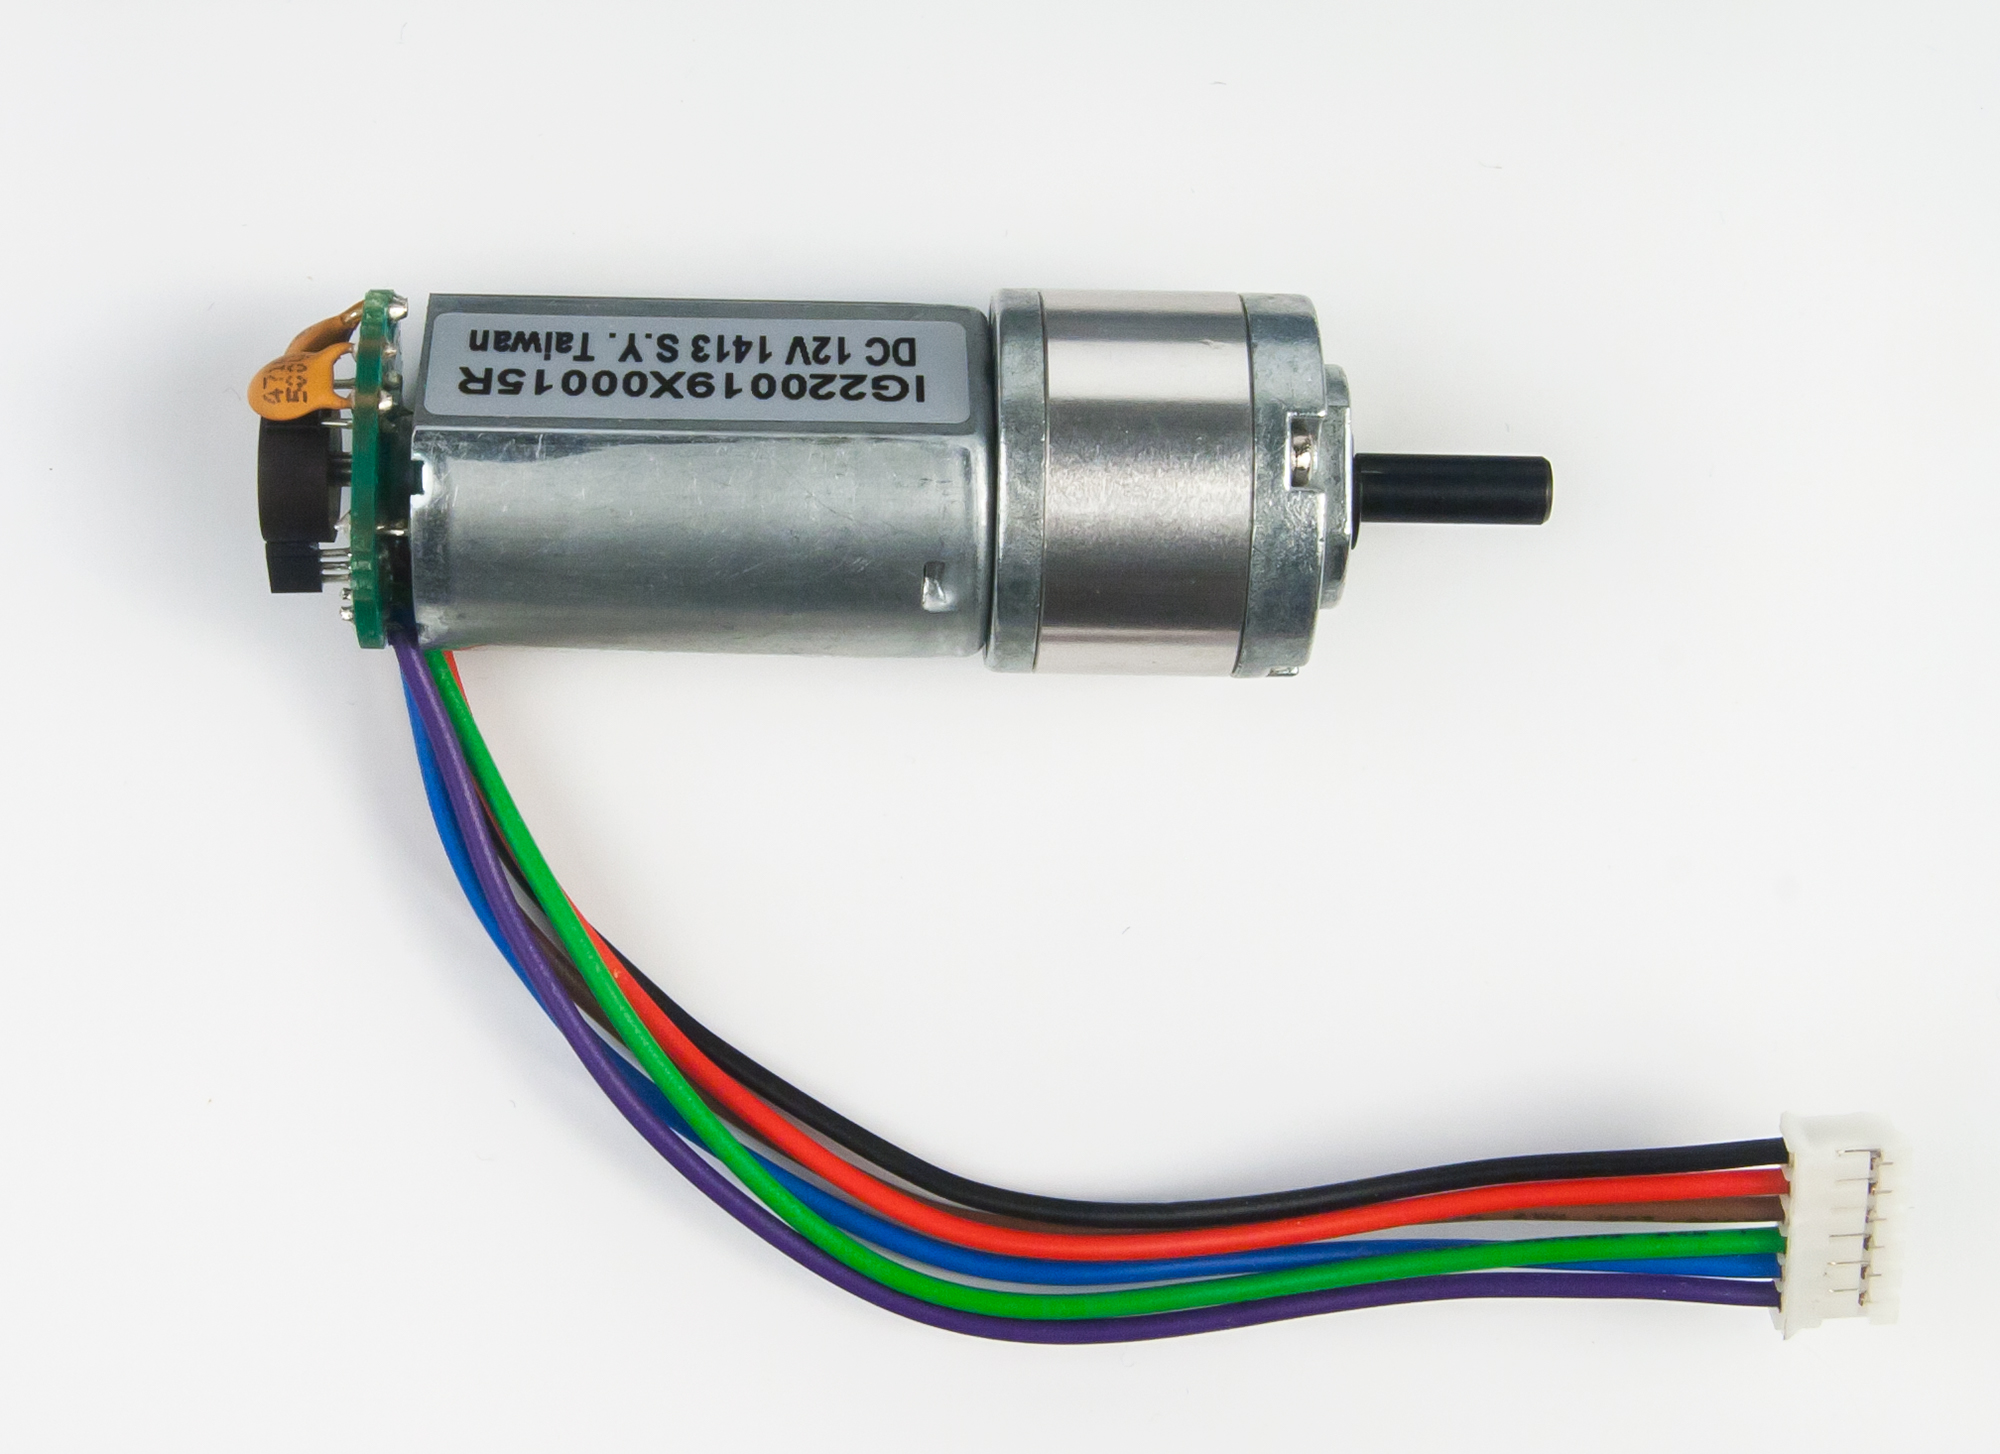 Figure 7.3. DC Motor with gearhead and bi-phase tachometer.
Figure 7.4 is a plot of the frequency produced by one of the Hall-effect sensors as a function of the percent duty cycle of a pulse-width modulated (PWM) signal. It can be readily seen that the motor speed as measured by the tachometer frequency is not a linear function of the motor control voltage produced by the PWM output. We will see in Lab 6B how to linearize the motor speed with respect to the analog control voltage.
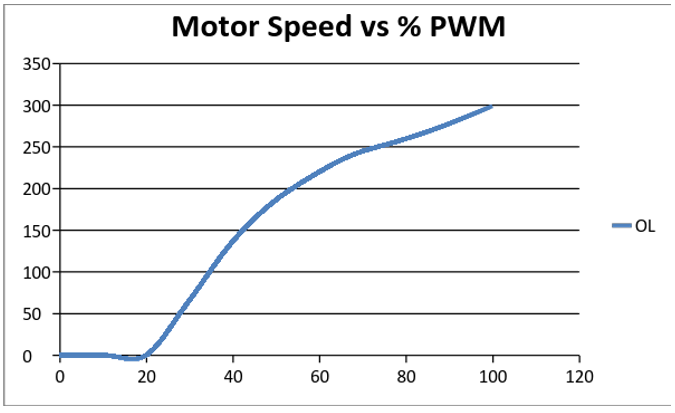 Figure 7.4. Tachometer Frequency vs %PWM for Open Loop control.
The primary question to be answered is, what is the maximum rate that frequency can be measured? In theory, it is twice the inverse of the period of the signal. The advantages and disadvantages to the common frequency measurement techniques are considered next.
7.2.1.1. Cycle Counting
There are two methods of measuring the frequency of the digital tachometer. The number of pulses can be counted per unit time or the inverse computed of the period between two successive transitions. Measuring frequency by counting cycles or pulses over short intervals is more accurate for signals when the frequency of the signal being measured is much greater than the frequency of measurements. The results should be many hundreds or even thousands of cycles being measured during the measurement period, thus providing a high resolution with a fixed measurement period.
One of the methods to mitigate the low number of cycles per fixed interval for low frequency signals is to employ frequency multiplication. Most modern microcontrollers and microprocessors use frequency multiplication so that the core speed of the processor is many times the processor crystal frequency using phased locked loop (PLL) circuits. The PIC32 processor family uses a multiplier set in the config_bits.h file.4) PLL circuits, being second order low-pass filters, have slow dynamic responses that will delay accurate frequency measurements.
7.2.1.2. Period Measurement
Using timer counts to measure a signal period is generally more accurate for relatively low frequency signals and is the method that will be implemented in Lab 6a and 6b. The speed of the motor rotor shaft can be measured by computing the period between two successive pulses of the motor tachometer by capturing the time for each transition. In order to achieve the measurement with relatively good accuracy, the period must be measured with a high resolution. This requires that the timer must be counting at a much higher rate than the period of the of the tachometer signal. The accuracy of the frequency is preserved by inverting the period using floating point variables.
Measurement resolution is provided by the number of timer counts between input signal transitions. The measurement period depends on the frequency of the input signal and, for very low frequency signals, may result in excessively long delays between measurement updates. Note that the range of speed is from zero to 300 revolutions per second (RPS). Since the Hall-effect sensor creates a pulse every revolution, the period of revolution is from infinity at zero RPS to 3.33 ms at 300 RPS. Obviously, zero RPS presents a problem for the microprocessor, hence one must consider means of assigning a maximum limit to the tachometer period.
The task is to select the timer input clock rate that will provide adequate period accuracy across the range of possible tachometer frequencies. From the derivation shown in Appendix B, for a given measurement period, the granularity of any input frequency can be determined using Eq. 7.3.
$$\Delta = \frac{T3_{CLK\_PD}}{T_{SIGNAL}} \cdot F_{SIGNAL} = T3_{CLK\_PD}F_{SIGNAL}2 \qquad (Eq. 7.3)$$
Where $F_{SIGNAL} = 1/T_{SIGNAL}$ and $T3_{PD} = T3_{PRESCALE}/PBCLK$
Eq. 7.3 demonstrates that granularity, $\Delta F$, increases as the square of the input frequency and has dimensions of Hz. For example, a peripheral bus clock (PBCLK) rate of 10 MHz and a timer pre-scale value of 16 will result in a 0.064 Hz/timer count granularity if the tachometer frequency is 200 Hz. Since the maximum period is 65536 timer counts, the minimum measurable frequency is 4.768 Hz. As Fig. 7.5 demonstrates, a higher input frequency results in a higher granularity of the measurement for a given period of measurement. Better resolution (lower granularity) can be achieved by extending the measurement period, $T3_{PD}$, which is the same result as a lower input frequency.
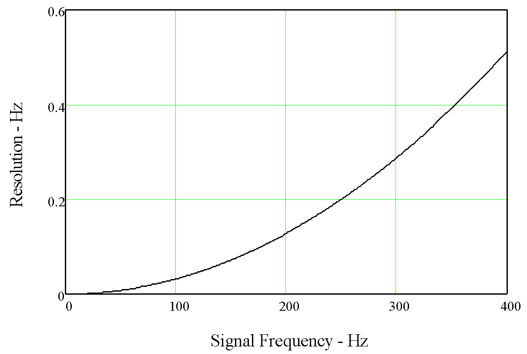 Figure 7.5. Plot of frequency measurement resolution.
7.2.1.3. Tachometer Interface
The DC motor plus encoder shown in Fig. 7.3 has a 6 pin connector, shown in Fig. 7.5 below. The hardware configuration with the Basys MX3 board is shown in Fig. A.1. The wires in Fig. 7.6 attach to the DC motor assembly with pin assignments as shown in Table 7.1. The brown, green and blue wires interface a processor input pin to the Hall Sensor A output, as shown in Fig. 7.7. Hall Sensor B is not used for Lab 6a or 6b.
Table 7.1. DC motor connector pin assignment.
| Pin Number | Wire Color | Function | Basys MX3 |
|---|---|---|---|
| 1 | Black | Motor - | J5 – A1 |
| 2 | Red | Motor + | J5 – A2 |
| 3 | Brown | Hall Sensor VCC (3.3V) | JA – 11 |
| 4 | Green | Hall Sensor GND | JA – 12 |
| 5 | Blue | Hall Sensor Output A | JA – 10 |
| 6 | Purple | Hall Sensor Output B | No Connection |
The Hall Sensor outputs have an open collector configuration, thus requiring a pull-up resistor. Since only some of the PIC32MX370 pins have pull-up resistors, our task is to select an I/O pin that can be configured as an input capture and can be configured to have a pull-up resistor enabled. RG8 and RG9 that connect to JA9 and JA10 respectively meet these requirements. Listing 7.1 shows the C code required to configure Port G pin 9 for input capture.
Listing 7.1. Configuring I/O pin RG9 for Input Capture
   ANSELGbits.ANSG9 = 0;           // Set pin as digital IO
   TRISGbits.TRISG9 = 1;           // Set pin as input
   ConfigCNGPullups(CNG9_PULLUP_ENABLE);   // Enable pull-up resistor
   IC1R = 0b00000001;              // RG9 to Input Capture 1
   OpenTimer3( T3_ON | T3_PS_1_16, T3_TICK-1);	//Set Timer 3 clock rate
   OpenCapture1( IC_EVERY_RISE_EDGE | IC_INT_1CAPTURE | IC_TIMER3_SRC |\
                 IC_FEDGE_RISE | IC_ON );
   ConfigIntCapture1(IC_INT_ON | IC_INT_PRIOR_2 | IC_INT_SUB_PRIOR_0);
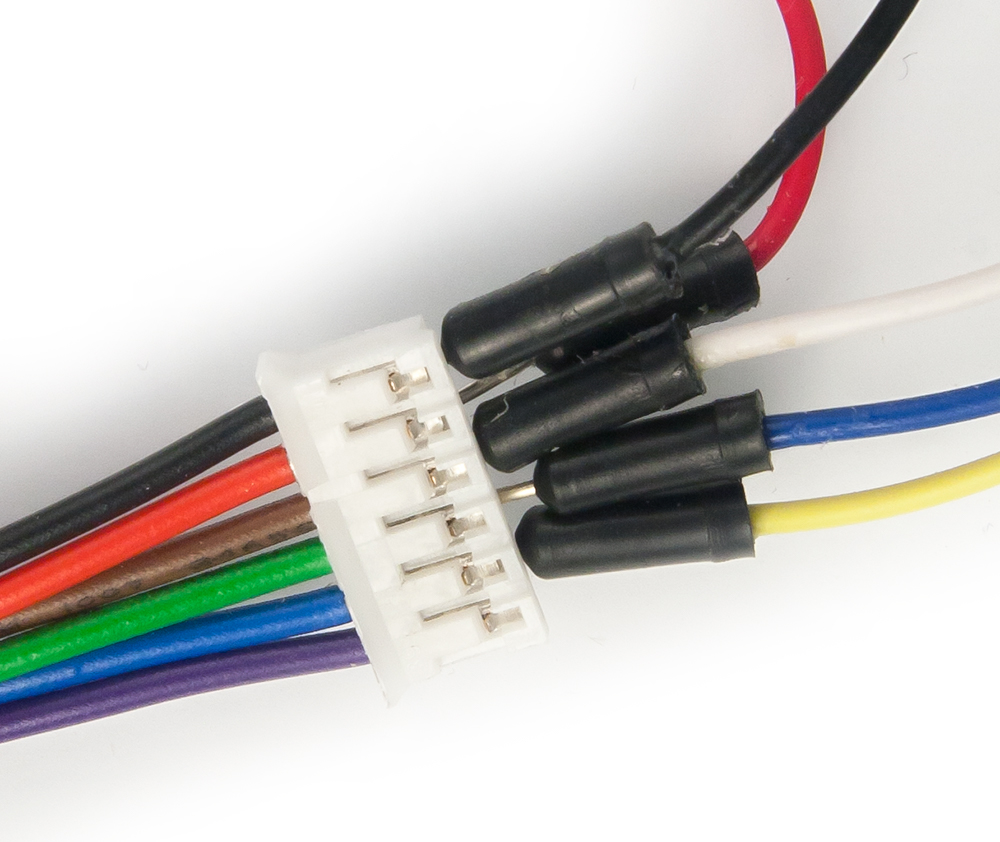 Figure 7.6. Motor Connector wiring.
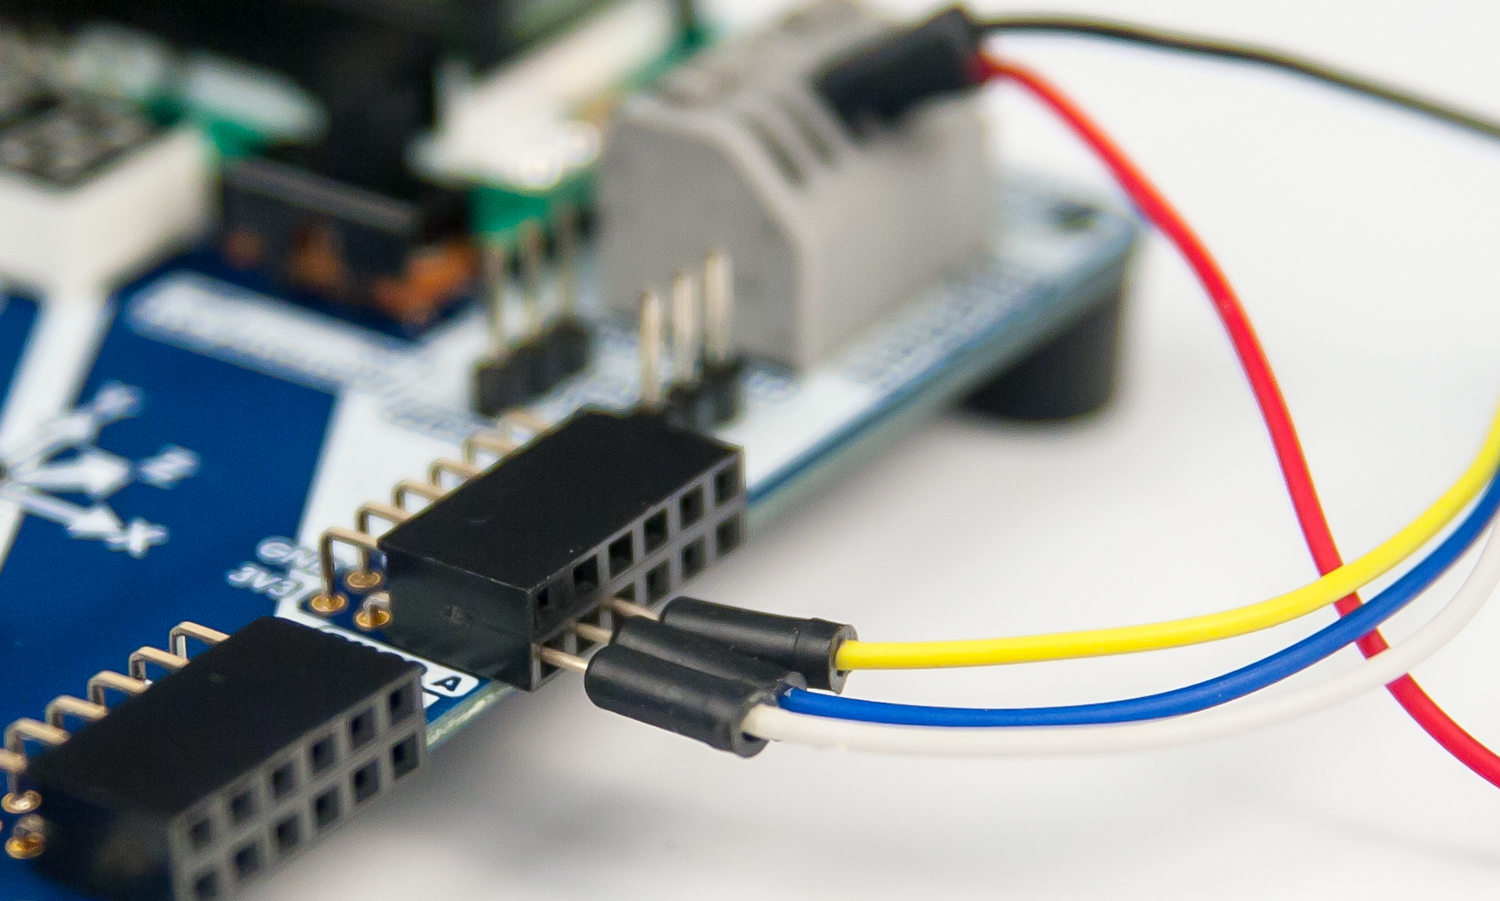 Figure 7.7. Pmod JA connector wiring.
7.2.2. Analog Output: Pulse-width Modulation
In Lab 5, we used pulse-width modulation to generate a communications signal of a constant frequency pulse train where the carrier frequency was turned on by setting the PWM output ratio to 9%, and off by setting the output PWM ratio to 100%. The information used to modulate the IR beam is contained in the amplitude modulation of the PWM carrier signal. In Labs 6a and 6b, the information is contained in the duty cycle of the PWM signal, which is a form of frequency modulation. This signal will be demodulated with low pass filtering to generate an analog control signal.
Lab 5 discussed the details of how to set up a PWM output using the output compare special function of the PIC32 processor. However, Lab 6a and 6b will require that we set up two PWM outputs that all use a common timer if the motor is to be capable of reversing direction. After initializing the timer to be used with the output compare and initializing the two output-compare channels, the PWM duty cycle of each individual channel is easily changed using the instruction SetDCOCxPWM(DC); where x denotes the PWM channel and DC is the compare setting. DC is computed by multiplying timer period register by the percent PWM. Provided that the two instructions used to modify the PWM duty cycle are completed within the PWM period, both outputs will simultaneously change their duty cycle at the end of the next PWM period.
Demodulation of PWM requires a low-pass filter that can be implemented with a simple RC (resistor-capacitor) filter as shown in Fig. 7.8. Fig. 7.9 shows the input – output relationship of filtering a PWM signal with 60% duty cycle. One observes from Fig. 7.9 that not all of the high frequency carrier signal is removed by the low-pass filter, but the amount of the carrier frequency that remains may be sufficiently reduced, depending on the application. Higher order filters and/or a higher carrier frequency will result in further reduction of the carrier signal from the demodulated signal. The cost of using a higher carrier frequency is the reduction of demodulated signal resolution. The cost of a higher order analog filter is the increased component count and expense.
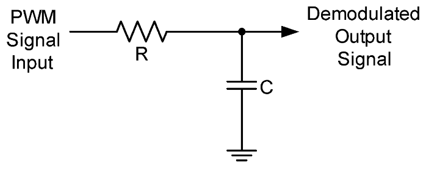 Figure 7.8. Analog RC Low-pass filter.
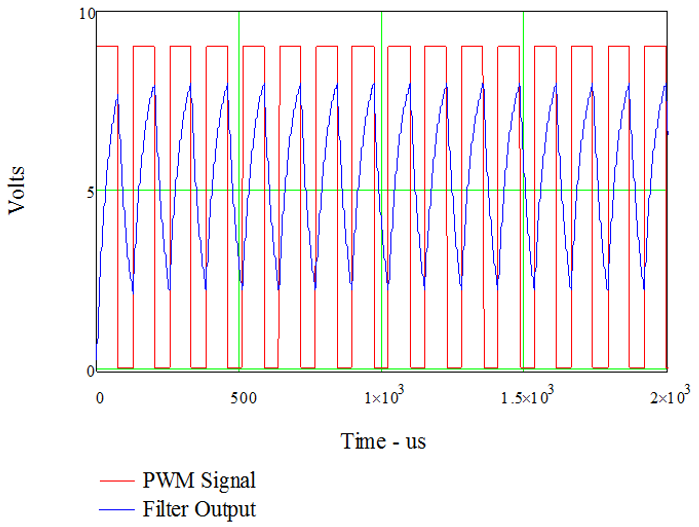 Figure 7.9. PWM Signal with 60% duty cycle and RC filter output.
For Lab 6a and Lab 6b, the rotor inertia of the DC motor itself provides all the needed low-pass filtering, provided the carrier frequency is sufficiently high.
7.2.3. Motor Speed Control
Figure 7.10 shows the electric model of a permanent magnet brushed DC motor, such as the one shown in Fig. 7.3. The torque of the motor is proportional to the armature current labeled Ia. The armature winding resistance, Ra, and winding inductance, La, are fixed. The back electromotive force (EMF) is proportional to the speed of the motor.
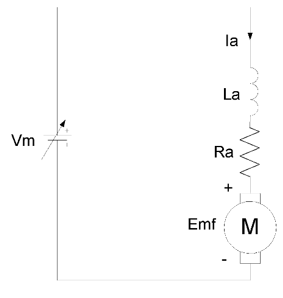 Figure 7.10. Electric model of a brushed DC motor.
When the motor voltage, Vm, is initially applied, the motor speed will increase until the back EMF plus the voltage drop across Ra due to the armature current, Ia, equals the applied voltage, Vm. The most common method of controlling the speed of a permanent magnet brushed DC motor is to vary the motor supply voltage, Vm. For a fixed Vm, if a mechanical load is applied to the shaft of the motor, the speed of the motor and the back EMF will decrease, resulting in increased armature current to generate the needed motor torque. If the speed is to remain constant for varying applied mechanical loads, the motor applied voltage, Vm, must change accordingly. We will vary the applied motor voltage by changing the PWM duty cycle as discussed below.
7.2.3.1. Motor Output Interface
The motor driver IC on the Basys MX3 processor platform is shown in Fig. 7.11. The motor wires used for power input and tachometer output are identified in Fig. 7.12. A 5.0 V external power supply is required to be connected to J11, marked as VBAR on the Basys MX3 processor board. A jumper must be used on JP1 to connect the 5V power, VBAR, to the motor supply, VM.
 Figure 7.11. Basys MX3 Motor driver circuit.
 Figure 7.12. Basys MX3 connection to motor power wiring.
For Labs 6a and 6b, only outputs A1 and A2 are connected to the leads of the DC motor (RED and BLACK). Switching the A1 and A2 connections to the motor causes the motor to rotate in the opposite direction.
Table 7.2. Motor driver IC7 connection to PIC32 processor.
| Function | IC7 Pin | PIC32 Port Pin | Function |
|---|---|---|---|
| AIN1 | 10 | RB3 | Motor Supply + |
| BIN1 | 8 | RE9 | Not Used - Set to zero |
| AIN2 | 9 | RE8 | Motor Supply - |
| BIN2 | 7 | RB5 | Not used – Set to zero |
| MODE | 11 | RF1 | Set to 0 |
7.2.3.2. DC Motor Speed Control
The percent PWM update rate should minimally match the input sample rate. Maximally, the percent PWM update rate should be less than or equal to the PWM carrier frequency. Attempting to update percent PWM any faster than the PWM carrier frequency will result in some updates being simply overwritten before being transferred to the primary timer compare register. Since two PWM outputs are used to synchronize the two outputs to the motor driver IC, both PWM channels must be updated in rapid succession. The code to do this is included with Lab 6a.
8. References
- K.M. Lynch, N. Marchuk, and M.L. Elwin, Embedded Computing and Mechatronics with the PIC32 Microcontroller, Newnes Publishers, 2016, ISBN 978-0-12-420165-1
- “Open-vs. closed-loop Control”, Vance VanDoren, Control Engineering, Aug. 28, 2014
- DRV8835 Data Sheet, https://www.pololu.com/file/0J570/drv8835.pdf
- “Brished DC Motor Basics Webinar”, John Moutton, Microchip Technologies Inc., http://www.microchip.com/stellent/groups/SiteComm_sg/documents/DeviceDoc/en543041.pdf
- “AN905 Brushed DC Motor Fundamentals”, Reston Condit, Microchip Technology Inc, Aug. 4, 2010, http://ww1.microchip.com/downloads/en/AppNotes/00905B.pdf
- AN538, “Using PWM to Generate Analog Output”, Amar Palacheria, Microchip Technology Inc., http://ww1.microchip.com/downloads/en/AppNotes/00538c.pdf
- “AB-022: PWM Frequency for Linear Motion Control”, Precision Microdrives™, https://www.precisionmicrodrives.com/application-notes/ab-022-pwm-frequency-for-linear-motion-control
- “AN1353 Op Amp Rectifier, Peak Detectors and Clamps”, Dragos Ducu, Microchip Technologies Inc., 2011, http://ww1.microchip.com/downloads/en/AppNotes/01353A.pdf
- Scientists and Engineer’s Guide to Digital Signal Processing, Dr. Steven W. Smith, http://www.dspguide.com/
- “Implementing a PID controller Using a PIC18 MCU”, Chris Valenti, Microchip Technologies Inc., 2005, http://ww1.microchip.com/downloads/en/AppNotes/00937a.pdf
Appendix A: DC Motor Connection to Basys MX3
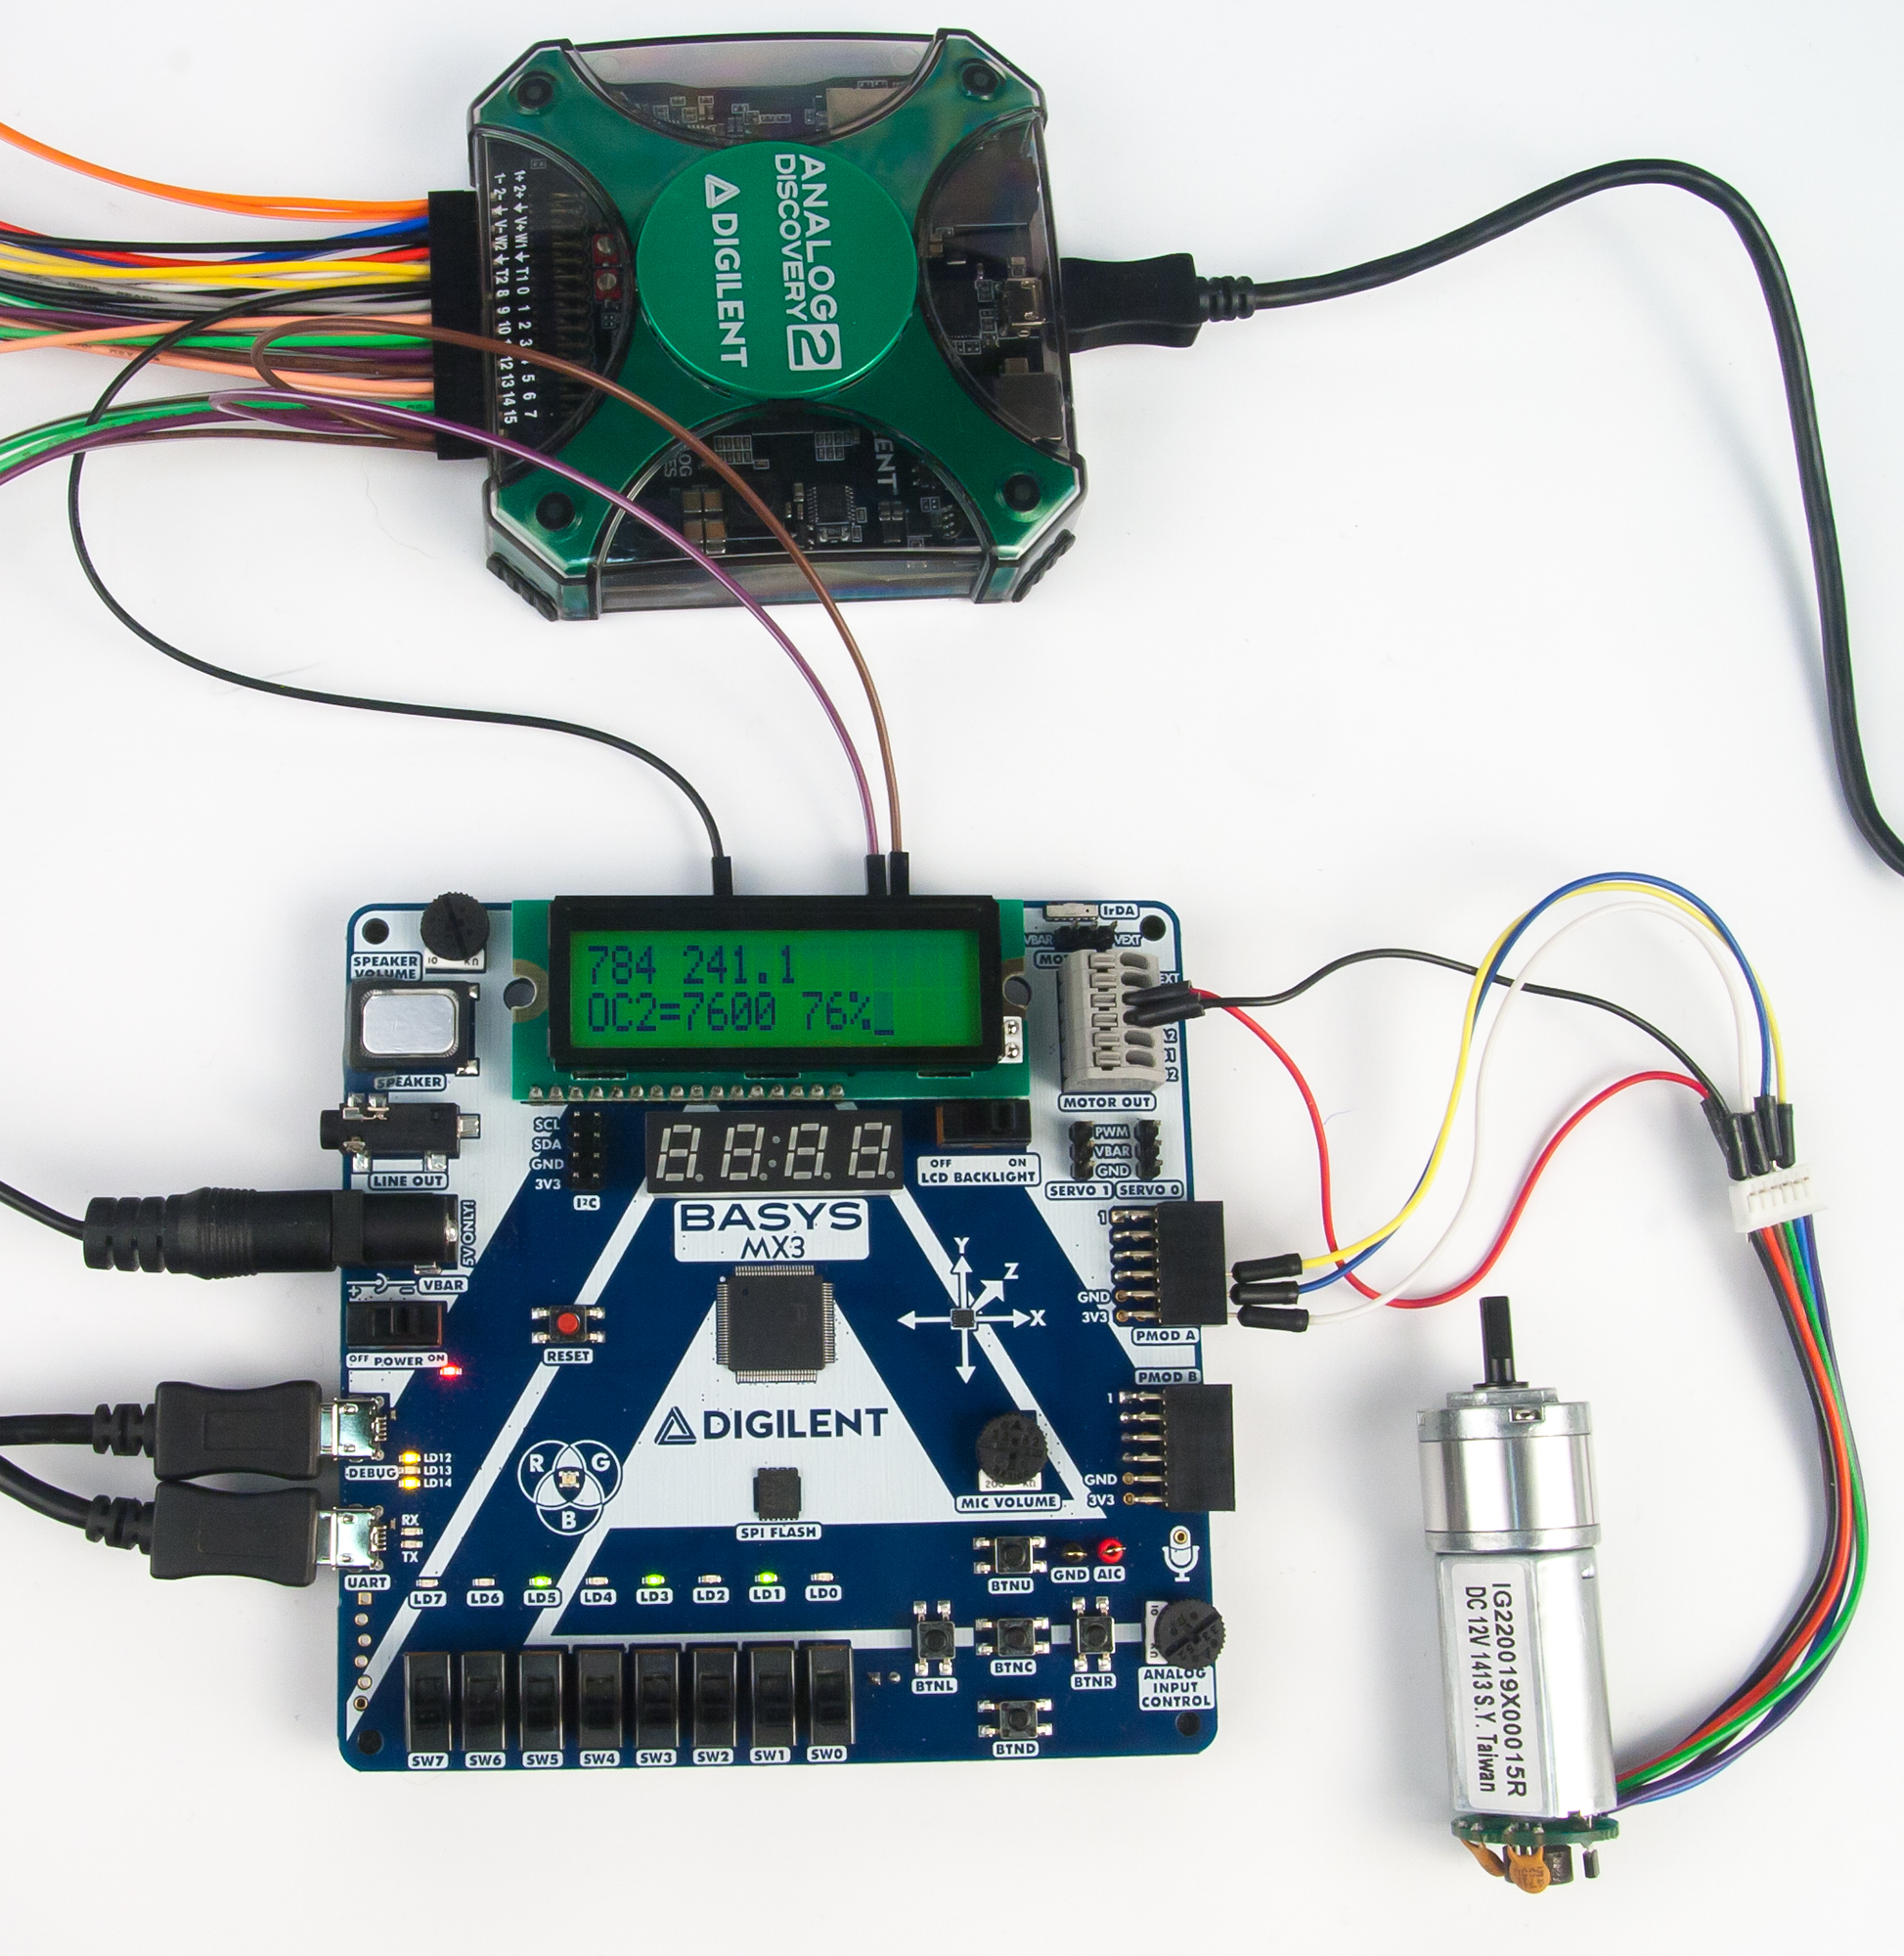 Figure A.1. Motor and tachometer wiring.
Appendix B: Frequency Measurement Resolution
Definition: The granularity of a sensor measurement is the smallest change it can detect in the quantity that it is measuring. Resolution, which is the inverse of granularity, is related to the precision with which the measurement is made in Units - Hz/Count.
Assume that Timer 3 count is recorded on each positive transition. Then for two frequencies, F1 and F2, the Timer 3 counts are computed by:
$$F_{TMR3} = \frac{PBCLK}{T3_{PS}} = \frac{10^7}{1} \qquad (Eq. B.1)$$
$$T3_{COUNT1} = \frac{F_{TMR3}}{F1} \qquad (Eq. B.2)$$
$$T3_{COUNT2} = \frac{F_{TMR3}}{F2} = \frac{10^7}{1} \qquad (Eq. B.3)$$
To compute the resolution in Hz per count, assume that the count difference is unity which results in Eq. B.4 or Eq. B.5, whichever expresses the desired units.
$$|T3_{COUNT1} - T3_{COUNT2} | = Granularity = (F_{TMR3}) \cdot | (\frac{1}{F2} - \frac{1}{F1} ) | COUNTS/Hz \qquad (Eq. B.4)$$
$$Resolution = ( \frac{1}{F_{TMR3}} ) \cdot ( \frac{1}{ | \frac{1}{F1} - \frac{1}{F2} | } ) = ( \frac{1}{F_{TMR3}} ) \cdot ( \frac{F1 \cdot F2}{ | F2 = F1 | } ) Hz/COUNT \qquad (Eq. B.5)$$
$$|F2-F1| = Resolution = ( \frac{F1 \cdot F2}{F_{TMR3}} ) Hz/COUNT \qquad (Eq. B.6)$$
If F1 approximately equals F2 at 1 Hz, the resolution is 0.0008 Hz/Count. At 200 Hz, the resolution is 1.28 Hz/Count.
Appendix C: Classical Control Theory
According to Reference 10, PID (proportional – integral - derivative) algorithms, as modeled in Fig. C.1, have been used in feedback control since 1940. Except for the fact that the mathematical model for Fig. C.1 is in the continuous domain, one can readily see that it is a simplified version of Fig. 6.1. The dynamics of the system are represented in the Laplace domain by the controller, C(s), the plant or machine, P(s), and the feedback, F(s). Each of the dynamic elements can be expressed as polynomials in the form of Eq. C.1.
$$G(s) = \frac{b_0 + b_1 \cdot s + b_2 \cdot s^2 + b_3 \cdot s^3 + \cdots + b_M \cdot s^M}{a_0 + a_1 \cdot s + a_2 \cdot s^2 + a_3 \cdot s^3 + \cdots + a_N \cdot s^N} \qquad Eq. C.1)$$
R(s) is the input reference variable, Y(s) is the output variable, E(s) is the error variable computed as the difference between the reference, R(s), and the feedback variable, F(s). F(s) is the feedback variable that is the transformed output representing the dynamics of the instrumentation.
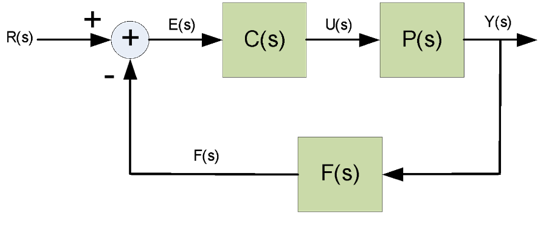 Figure C.1. Simplified block diagram of closed-loop control system.
$$Y(s) = P(s) \cdot U(s) \qquad (Eq. C.2)$$
$$U(s) = C(s) \cdot E(s) \qquad (Eq. C.3)$$
$$E(s) = R(s) - Y(s) \qquad (Eq. C.4)$$
$$\frac{Y(s)}{R(s)} = \frac{P(s) \cdot C(s)}{F(s) \cdot P(s) \cdot C(s)} = H(s) \qquad (Eq. C.5)$$
Although PID controllers give optimal control in regards to response time, minimum overshoot, and steady state error, the parameters that govern the controller behavior can be difficult to determine. If proportional gain is used exclusively, the gain would need to be infinite to result in zero control error. The instability of a PID control system is most often attributed to the derivative gain, hence Kd is often set to zero, resulting in PI control. Using proportional and integral (PI) control will result in zero steady state error using realizable gains. It turns out that many industrial plant process controllers use PI control.
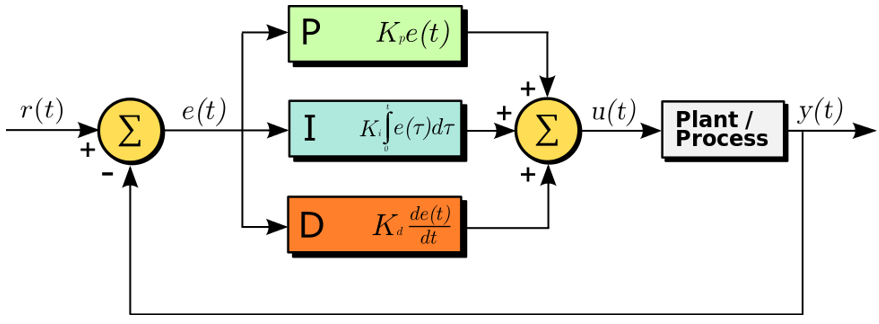 Figure C.2. Block diagram of a PID controller.5)
In the system shown in Fig. C.2, the term plant generally refers to a dynamic system that we are attempting to control in some specified manner, which for the case of Lab 6a and 6b is the speed of a DC motor. The voltage applied to the motor can be adjusted as needed in order to drive the difference between the desired speed (the reference inputs r(t) and the speed measured using the tachometer, y(t)) to approach zero. The motor cannot instantaneously change because of the laws of physics and electricity that govern the speed of the motor.
When using open loop control, we never really know how fast the motor is turning without monitoring. External influences such as fluctuations in the power, voltage, load, or friction losses will affect the motor speed. Imagine using an open loop control for speed control on your car (equating the speed of the motor with the car wheels). It would work as long as the car is subject to that same road and environmental conditions. But put a hill in the road and watch what happens. First, the car will slow to until the energy set by the position of the accelerator equals the energy needed to climb the hill at a reduced speed.
If the accelerator is controlled by the difference between the desired (or set) speed and the actual speed, we then have a proportional closed-loop system. This is called proportional control and mathematically the control algorithm is expressed as shown in Eq. C.6 where e(t) is the error signal and C(t) is the control output.
$$c(t) = K_p (V_{SET} - V_{TACH}) = K_p \cdot e(t) \qquad (Eq. C.6)$$
Eq. C.6 works well as long as there is sufficient error and gain (KP) to the control supplying gas to the motor. But as the car approaches the setpoint velocity, the error gets smaller until there is insufficient error such that, when multiplied by the gain, the system will achieve some kind of equilibrium. There will always be a finite error with strictly proportional control. Even though the error can be made smaller by increasing the gain, the error will never go to zero.
PI control to the rescue! When we add integration of the error signal to the control algorithm, then we can get zero steady state response errors for step inputs. Such a control algorithm is written using Laplace operators in Eq. C.7.
$$C(s) = (K-p + \frac{K_i}{s}) (V_{SET} - V_{TACH}) = (K_p + \frac{K_i}{s}) \cdot E(s) \qquad (Eq. C.7)$$
Thus, the control signal is proportional to the integral of the error signal, and in part, directly to the magnitude of the error signal itself. Because of this, this approach to control is referred to as PI (proportional-integral) control. A distinct advantage of PI control is that using it results in zero steady state error for a first order plant (G1(s) = k/s). Now computers can’t solve equations in the continuous domain, therefore we must transform to a discrete domain that allows us to use samples of continuous signals. Eq. C.8 is the transformation from continuous to discrete time domain that is based upon rectangular integration. Ts is the interval between samples of the input.
$$s = \bigg( \frac{1-z^{-1}}{T_s} \bigg) \qquad (Eq. C.8)$$
Completing the appropriate computations after substituting Eq. C.8 into Eq. C.7, we end up with a discrete time equation shown in Eq. C.9.
$$C(z) = (K_p + K_i \cdot (1-z^{-1}) \cdot E(z) \qquad (Eq. C.9)$$
A more popular conversion is based upon the trapezoidal rule integration and is called the bilinear transformation and is expressed in Eq. C.10. This transformation is actually a better approximation of the exact transformation $s = e^{-jwTs}$ than is Eq. C.8. Substituting Eq. C.10 into Eq. C.7, we get the result shown in Eq. C.11. After some simplification we arrive at Eq. C.12.
$$s = \bigg( \frac{2}{T_s} \bigg) \bigg( \frac{1-z^{-1}}{1+z^{-1}} \bigg) \qquad (Eq. C.10)$$
$$C(z) = (E(z)) \bigg[ K_p + \frac{T_sK_i}{2} \bigg( \frac{1+z^{-1}}{1-z^{-1}} \bigg) \bigg] = \bigg( \frac{E(z)}{1-z^{-1}} \bigg) \cdot \bigg[ \bigg( \frac{T_sK_i}{2} + K_p \bigg) + \bigg( \frac{T_sK_i}{2} - K_p \bigg) \cdot z^{-1} \qquad (Eq. C.11)$$
Or
$$C(z) \cdot (1-z^{-1}) = \bigg[ \bigg( \frac{T_sK_i}{2} + K_p \bigg) \bigg] \cdot E(z) + \bigg( \frac{T_sK_i}{2} - K_p \bigg) \cdot E(z)z^{-1} \qquad (Eq. C.12)$$
So the question that is begged to be answered is what is z-1? Well for our purposes, it is the delay operator and any variable multiplied by the delay operator is simply that variable at the previous time interval. So Eq. C.12 can now be written as Eq. C.13, which is a difference equation that can be solved by any computer, microprocessor, or microcontroller. The code to implement the pseudocode shown in Listing C.1 becomes the computer algorithm block shown back in Fig. 6.1. It is executed at the rate that the control loop operates.
$$c_n = \bigg( \frac{T_sK_i}{2} + K_p \bigg) \cdot e_n + \bigg( \frac{T_sK_i}{2} - K_p \bigg) \cdot e_{n-1} + c_{n-1} \qquad (Eq. C.13)$$
Listing C.1. Pseudo code for Digital PI controller
#define GetPeripheralClock() 10000000			// PBCLK set in config_bits.h
#define PWM_MAX (GetPeripheralClock()/10000)		// Set output range
#define PWM_MIN 0

static int ERROR = 0;					// Initial value for en-1
static int CTRL = 0;					// Initial value for cnn-1

TACH = Read motor speed (Hz);				// Global variable set by InputCapture ISR
// The SET_SPEED reference input is scales using a first order polynomial in the form y = ax + b to set the slope, a, with
//  units rps/ADC bit and ”b” being the minimum speed when the ADC input is zero
SET_SPEED = Scaled potentiometer setting 		               // Determine speed set point from ADC

ERROR_LAST = ERROR;				               // Save previous error and control values
CTRL_LAST = CTRL;
ERROR = SET_SPEED - TACH;			              // Compute new error value

CTRL = (KP + KI)*ERROR - (KP - KI)*ERROR_LAST + CTRL_LAST; // Compute new control output value

if(CTRL > PWM_MAX) then PWM_CONTROL = PWM_MAX; else	// Limit output range to prevent windup
{
If (CTRL < PWM_MIN)  then PWM_CONTROL = PWM_MIN;  else
PWM_CONTROL = CTRL;				// Output PWM value
}
In the above code listing, the integral gain $KI$ is equal to $(T/2)K_i$. An alternative approach for controlling motor speed can be found in any control theory text book that includes derivative control, but is not required for this assignment. Other approaches may be found in various control theory text books.

