This is an old revision of the document!
UNDER CONSTRUCTION
Analog Discovery 2 - Using the Logic Analyzer
Logic analyzers are used to record and analyze digital communication signals. They work in a similar manner to an oscilloscope, but the data is processed and displayed with additional data that is calculated by the software to help with this analysis. With the Analog Discovery 2 and WaveForms 2015, you can record and decipher most types of digital communication signals
Inventory
- A chipKIT microcontroller. For this tutorial we will be using the uC32.
- Arduino IDE with chipKIT Core installed
- A USB cable
- A Windows, Linux, or Mac computer with USB port to run the software
-
- You may also use the original Analog Discovery or the Electronics Explorer Board with WaveForms 2015. There are some slight differences in functionality between the Analog Discovery Legacy, Analog Discovery 2, and the Electronics Explorer Board, but nothing that will prevent you from following along if you have one of the other tools.
- WaveForms 2015 software
Step 1: The Logic Analyzer
If you want some help getting your Analog Discovery 2 set up and calibrated, or installing WaveForms 2015, check out the quick start tutorials.
Once you have your Analog Discovery 2 and WaveForms 2015 all set up, open the Logic Analyzer by clicking on the “Logic” button.
This will open the Logic Analyzer window.
Along the top you'll see the “File”, “Control”, “View”, and “Window” options.
Under “File” you'll see several options.
You can add a new instance of the logic analyzer, either by cloning the current analyzer settings or opening an empty instance with default settings. You can also “Save” the current logic analyzer settings, or “Open” a previously saved project. “Export” lets you save the current logic analyzer plot data, either as an image of the window in most common formats, e.g. *.bmp, *.jpg, *.tif, etc., or as a data file with the plot window information in either *.csv, *.txt, or *.tdms formats. “Close Logic” will close the logic analyzer window. This will not clear the current settings as long as you don't close WaveForms 2015 completely. Just click on the “Logic” button again and the window will pop back open with all of the same settings.
Under “Control”, you have access to the tool's Single, Run, and Stop acquisition commands.
“View” opens different windows to let you view and analyze the captured data.
“Window” lets you switch between the Help window, the WaveForms 2015 welcome window, or any tool window currently open.
Next, you'll see the logic analyzer controls.
“Single” allows you to capture one window worth of data. To capture more data, adjust the time base of the plot window.
“Run” will start the tool for continuous acquisition. This button becomes “Stop” once the tool is running.
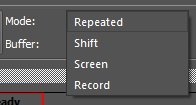
The “Mode” box lets you change how the data is displayed in the plot window, either one full plot at a time, real-time that wraps around once the end is reached, real-time side-scrolling, or you can record data. The example project will utilize the record function, so stay tuned for that.
The Logic Analyzer uses the computer memory to store past data acquisitions in a buffer. It keeps a running tally of which buffer you are currently using. Clicking on the green plus sign, displayed in Fig. 11, lets you save the currently shown acquisition data to a new tab. The name of the tab can be edited by double clicking the tab header.
You can trigger the Logic analyzer several different ways by clicking the “Trigger” box.
“Auto” is selected by default. The tool will wait approximately 2 seconds once started. If no trigger is detected, acquisition will start automatically. “Normal” will place the tool in “Armed” mode once started. The tool will wait indefinitely for the determined trigger condition, at which point acquisition begins. “None” will ignore trigger settings and immediately start acquiring data once the tool is started.
You can set the source of your trigger by clicking the “Source” box.
“Digital”, “Scope”, “Wavegen 1”, “Wavegen 2”, and “Patterns” refer to the Static I/O, Oscilloscope, Waveform Generator, and Pattern Generator tools of the Analog Discovery 2. “Manual” refers to the manual trigger button at the bottom left of the Waveforms window. “External 1” and “External 2” corresponds to the trigger pins T1 and T2, respectively, on the Analog Discovery 2's 30-pin header and allow you to connect any other external trigger source you wish.
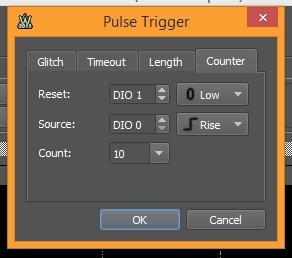
Clicking “Pulse” opens the pulse configuration window. It is not recommended you use the Pulse or Advanced windows if you can avoid it. Protocol-specific trigger “wizards” are available from the grid setting options, which are covered in the next step.
The “Glitch” tab is selected by default and triggers the acquisition when a signal pulse shorter than the specified time is registered.
“Timeout” triggers the acquisition when a signal pulse longer than the specified time is registered.
“Length” triggers the acquisition when a signal pulse of exact length with the given hysteresis is registered.
“Counter” looks for a set number of specified edges before starting acquisition.
The “Advanced” button opens a window for advanced trigger settings.
Each protocol has its own specific trigger wizard, which are covered in the steps relating to each protocol. Since the wizards will configure the advanced options as needed, it is recommended that the wizards are utilized to set advanced options.
In order to adjust or apply an advanced option, you will need to have added a channel to the grid, which will be covered in the next step. Also, be sure that the Advanced box is checked. Clicking “Clear” will clear all settings to default, including unchecking Advanced.
Click the “Reset Condition” to set the trigger reset conditions for the tool.
Your choices will appear in the grid in the “R” column. Once you clock “Close”, you will also see a text-based logic equation in the box next to the “Reset Condition” button in the “Trigger” window.
Click the “Trigger Event” button to set the trigger event condition for the tool.
Your choices will appear in the grid in the “T” column. Once you click “Close”, you will also see a text-based logic equation in the box next to the “Trigger Event” button in the “Trigger” window.
“Count” specifies how many edge counts should be ignored before triggering acquisition. You can specify up to 215 (32,768) counts. Check “Restart” to restart the counter once the count has been reached.
With “One wire” unchecked, “Filter” specifies the filter time for which a trigger containing an edge condition (rise, fall, or edge) does not detect further events. This also delays the sampling rate fir deserializer. For a trigger without an edge condition (rise, fall, or edge), “Minimum” specifies the minimum stable period. “Maximum” is not used for a trigger with an edge condition. For a trigger without an edge condition, it specifies the maximum stable period.
With “One wire” checked, “Bit” specifies the bit length. Sampling rate for the deserializer is also half this time length. “Timeout” specifies the protocol timeout. “Stuffing” tells the analyzer to skip the bit after the specified number of consecutive equal bits. You can specify up to 128 bits.
Check “Deserialize” to use the deserializer unit. This function internally converts the serial data into parallel data, allowing the system to look at all of the bits at once. There is no user access to this parallel data. “Pin” specifies the pin from which to read the incoming serial data. “Value” and “Mask” are used together to mask the deserialized bits to compare to value. You can enter the values for Value and Mask in decimal, binary, or hexidecimal and the program will convert it and display it in hex format. Use this option to check specific bit states in a serial signal and then use that exact condition as your trigger.
Step 2: The Grid (Part I)
The next section is the grid itself.
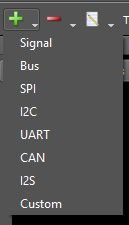
Click the green plus drop-down to open a menu where you can select which type of data protocol you would like to analyze. Details on each choice are a bit farther down in this step. For our example, we will be analyzing a UART signal.
Click on the red minus drop-down to delete a selected protocol, or click on the “Clear” button to clear the entire grid. You can also press the delete key on your keyboard to delete a selected protocol.
The button displayed in Fig. 49 opens the properties editor for whichever protocol channel is selected in the grid. This is the same window that opens when you first select a protocol to add to the grid.
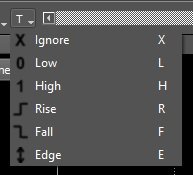
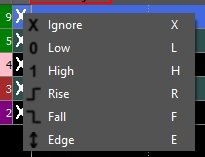
The “T” drops down the basic trigger settings. In order to use this menu, you have to have a specific DIO channel selected within the protocol being analyzed. You can choose “X” to ignore this channel, “L” to trigger when the signal is low, “H” to trigger when the signal is high, “R” to trigger when the signal rises from low to high, “F” to trigger when the signal falls from high to low, or “E” to trigger on any falling or rising edge. These settings can be accesses in multiple ways, and most protocols have their own specific trigger settings utilizing a trigger wizard, so if you don't see what you want here, keep reading.
Use the scroll bar, displayed in Fig. 52, above the plot window to move the data window left/right once the data has been captured. Click on the arrows to change the position by a base span and double click to set the leftmost or rightmost position. Double click on the scroll area to reset the time to show the entire acquisition.
Below the scroll bar and to the left is the acquisition state indicator labeled “Done”. It's simply a visual indicator of the tool state, showing information such as whether the trigger is armed and ready or whether the tool is done collecting data. To the right of that, you'll see a print out of the number of samples, sample rate, and time of acquisition for the last acquisition captured. The data displayed here will also change to display data specific to each protocol as you move your mouse cursor over the data captured in each channel in the plot window below.
To the far right of the screen you have two buttons, one for hot track and one to change plot window settings. Hot track is explained a bit later with the demonstration example. From the plot window settings, you can adjust the plot background color between “light” (white), “dark” (black), or “default” (dark gray). You can adjust the size, from 1-4 point, of the data plotted. You can also adjust and reset where the analyzer starts interpreting the captured data. This can also be accomplished by simply right clicking on the plot where you want to begin analyzing and selecting “Start from here”. All previous data will be ignored and the remaining data will be interpreted accordingly. Figures 57 & 58 illustrate this with a UART signal.
Original UART data captured. Notice how the 8-bit data packets are clearly interpreted and displayed above as both hexidecimal (h1B, h5B, h6A, h1B, h5B) and ASCII characters (“ESC”, “[”, “j”, “ESC”, “[”).
Now telling the tool to adjust where to start reading the UART data, beginning where it “sees” a UART Start bit. Notice how the data displays incorrectly, missing one packet entirely and complaining of framing errors and skipping some bits. But by the fifth packet (second “[”) the tool had zeroed in on the correct UART sequence of bits and was able to decipher the remaining data correctly.
Signal
Now let's add protocols to the grid. By clicking on the green plus drop-down, you can add several different protocols to the grid.
Be aware that you can assign DIO channels to multiple protocols, i.e., you can use DIO 0 to watch you UART data signal as well as your I2C SCL signal. Notice the “*” in the colored box in the IO column to indicate that the DIO is doubled up.
Whatever data is captured will be displayed wherever that particular DIO is assigned. Luckily, you have 16 DIO pins (32 with the Electronics Explorer Board), so you should have no problem spacing out your protocols across the pins. Tyr and avoid doubling up if you can help it.
The first protocol in the list is Signal. Note that selecting any protocol will first open a small property editor window.
Select one or multiple signals using the “Shift” and/or “Ctrl” keys on your keyboard. Once you have your channels selected, click the “Add” button to add the selected signals to the grid.
You can edit each channel by double clicking it on the grid, or clicking either edit button in the grid next to the signal name or above the grid. For Signal, the only thing you can edit is the name of the channel. You can change the trigger condition from the grid by clicking on the symbol in the “T” column. “X” is set by default, but the same options described above apply here as well.
Bus
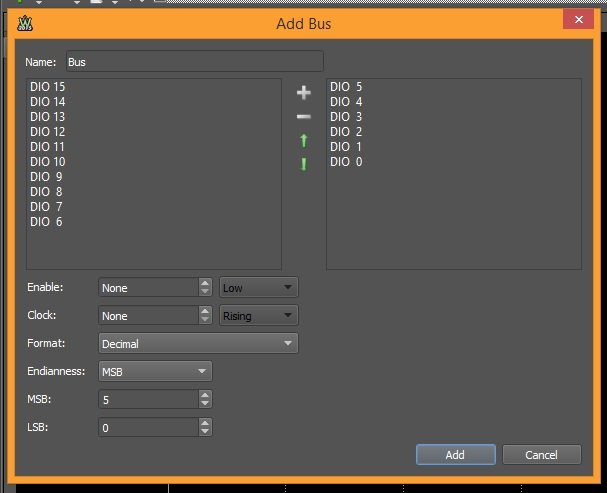
The next protocol option is “Bus”.
Select the channels you want to use for your bus in the left table. Click on the white plus sign to add them to the table on the right. Remove any channel from the right hand side by selecting it and clicking on the white minus button. Clicking on the up or down green arrows with a channel selected allows you to change the order of the channels in the bus.
“Enable” selects and optional enable pin and polarity.
“Clock” selects the optional clock pin and sampling edge.
“Format” allows you to choose the numerical format for how the interpreted data is displayed. There are a number of formats to choose from.
“Endianness” sets how the data is interpreted, either MSB first or LSB first.
“MSB” and “LSB” set the values for the first and last indices. The minimum for LSB is -32 and the maximum for MSB is +31. Changing either will change both, maintaining a separation difference equal to the number of channels assigned to the bus. This tool works like bit shifting the interpreted data, adjusting up/down the max/min values interpreted by the bus by a factor of 2 with each increase/decrease of the indices.
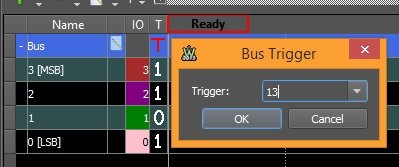
Click on “T” to open the trigger wizard.
With this wizard, you can set the trigger condition to look for a specific set of bits, corresponding to the number entered in the box. You can also set the individual trigger for any of the bus channels simply by clicking on the trigger symbol in the “T” column. Note that the tool will only trigger if the trigger settings fro all channels in the bus have been met when the data sample is taken.
SPI
Next on the list of protocols is Serial Peripheral Interface, or SPI, which is used extensively in embedded applications for synchronous serial communication.
Set the “Name” for your SPI.
Assign a DIO to “Select” to watch the slave select signal and set the “Active” status as high or low.
Set a second DIO to watch the “Clock” signal and set it to “Sample” on either the clock rising or falling edge.
Set a third DIO to watch the “Data” signal (either MISO or MOSI) and set whether the “First” bit in the data packet is the MSB or LSB.
“Bits” lets you set the bit size of your data packet (1-32 bits).
“Format” allows you to choose the numerical format for how the interpreted data is displayed. There are a number of formats to choose from.
“Leading: lets you set how many leading bits should be skipped when calculating the data value. Similarly, “Ending” sets how many trailing bits should be skipped when calculating the data value.
Using “Start”, you can delay the start of acquisition with respect to the first sample.
Once you have your SPI defined, click “Add” to add it to the grid. Once there, you can edit the SPI properties by double-clicking any of the SPI channels, or by clicking either of the property editor buttons.
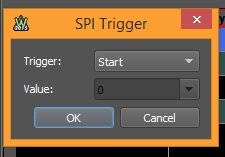
Open the SPI trigger wizard by clicking on the red “T” in the column.
You can set it to “Trigger” on SPI start, SPI Stop, or when a specific “Value” appears in the data packet. If you choose Value, define what value to look for in the Value box.
I2C
The next protocol on the list is Inter-integrated Circuit, or I2C. This protocol is also known as Two-wire Interface, or TWI. Like SPI, I2C is also used extensively in embedded systems communication.
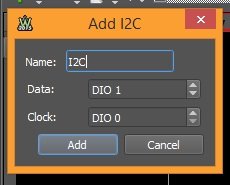
As the alternate name, TWI, implies, I2C only uses two wires, so the protocol is really easy to set up. Define the “Name” of the protocol and set the “Data” and “Clock” channels.
Once you have your I2C defined, click “Add” to add the protocol to the grid. Once there, you can edit the I2C properties by double-clicking any of the I2C channels, or by clicking either of the property editor buttons.
Open the I2C trigger wizard by clicking on the red “T” in the column.
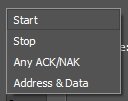
The default “Trigger” setting is to trigger once the I2 signal starts. But you can choose from several other options as well.
“Start” and “Stop” have no additional settings to define.
“Any ACK/NAK” will trigger acquisition on an acknowledge or not acknowledge signal. You can also set the option to Ignore any ACK/NAK signal.
“Address & Data” makes use of all options in the trigger wizard.
“Address” can be set to look for a specific peripheral device address. Valid address values are between h00 and h7F.
Set “ReadWrite” to trigger when reading or writing data to/from the device at the specified address, or set to ignore.
Set “Byte 1” and “Byte 2” to look for specific bytes in the data packet.
All three “Acknowledge” options look for the ACK or NAK data with the specified option. These can also be set to ignore the ACK/NAK data.
Step 3: The Grid (Part II)
UART
Next is Universal Asynchronous Receiver/Transmitter, or UART. If you are familiar with microcontrollers in either the chipKIT or Arduino families, the Serial library uses UART to transmit/receive data.
Add any name for the UART protocol in the “Name” box.
Set the Analog Discovery 2 DIO pin with “Data” to monitor the data being sent or received. You can only monitor either the TX or RX line with one instance of UART with the Logic Analyzer. If you need or want to monitor both TX and RX at the same time, simply add another instance of UART to the grid, assigning the second data line to the second instance.
Define how many bits are in your data packet with “Bits”. You have a range of 1-32 bits for the data packet size.
“Parity” is defined as Odd, Even, Mark, or Space depending on the settings of the signal under observation. Select None if no parity bit is used.
“Stop” lets you define how many stop bits are present in the signal.
The default baud rate is set at 9600, but set “Baud” to “Manual” to manually set the “Rate to a different setting.
Set a delay in data interpretation using “Start”. The interpreter will not begin until that much time has passed with respect to the first sample.
Once you have your UART defined, click “Add” to add it to the grid.
To edit the UART protocol, double click the Data channel in the grid or click on either of the property editors. Make the appropriate edits, then click “OK” to return to the grid.
Click on the “T” to open the trigger wizard.
You can set the tool to trigger on Break, Idle, or a Value. If Value is chosen, enter the value of the data packet in the “Value” box. Click on “Ok” to return to the grid.
CAN
Next is the Controlled Area Network, or CAN, which is used in automotive and robotic applications to communicate with all of ther peripheral devices on one main bus.
Name the CAN protocol whatever you want in the “Name” box.
Set the Analog Discovery 2 DIO pin with “Data” to monitor the data.
Set the “Polarity” to either High or Low.
Adjust “Rate” to whatever rate you have your signal set at.
Set a delay in data interpretation using “Start”. The interpreter will not begin until that much time has passed with respect to the first sample.
Once you have you CAN defined, click “Add” to add it to the grid.
To edit the CAN protocol, double click the Data channel in the grid or click on either of the property editor buttons. Make the appropriate edits, then click “OK” to return to the grid.
Click on the red “T” to open the trigger wizard.
You can set the “Trigger” to Error, Break, or Identifier. The remaining fields only apply if Identifier is selected as the trigger.
Choose between 11-bit or 29-bit identifier in the “Extended” box.
Define the identifier value in the “Identifier” box.
In the “Request” box, select between Data and Remote request types. You can select Ignore if you wish to ignore requests.
In the “Bytes” box, you can define the data section byte length, or choose to ignore this field.
Once the CAN trigger is defined, click “OK” to return to the grid.
I2S
The last defined protocol on the list is the Inter-IC Sound, or I2S, which was designed to transmit digital audio data. It is not related to the I2C protocol, so be sure not to confuse the two.
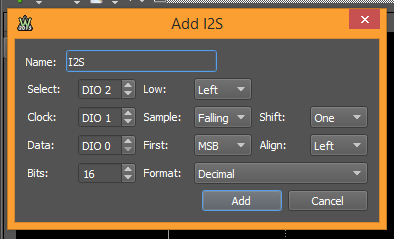
Set the name of your protocol in the “Name” box.
“Select” sets the DIO pin to monitor the Word Select line. “Low” determines which channel, left or right, is active when Select is low.
“Clock” sets the DIO pin to monitor the Clock line. Set “Sample” to determine which edge of the clock, rising or falling, is the sample edge.
“Shift” allows you to set whether the data bits are shifted with respect to the clock signal.
“Data” sets the DIO pin to monitor the Data line. Use “First” to set whether the first bit in the data packet is MSB or LSB. “Align” lets you set whether the data packet is right or left aligned with respect to the data frame edges.
Set the size, in bits, of the data packet in the “Bits” box. Values can range from 1 to 32 bits.
“Format” determines which numerical format to use to display the interpreted data on the plot.
Once you have your I2S defined, click “Add: to add it to the grid.
To edit the I2S protocol, double click and I2S channel in the grid or click on either of the property editor buttons. Make the appropriate edits, then click “OK” to return to the grid.
Click on the red “T” to open the trigger wizard.
Set the “Channel”, right or left, to use as the trigger source.
Set a specific watch value in the “Value” box. You can also ignore data packets if you wish. The value range corresponds to the number of bits defined in the data packet in the properties window.
Use “Clocks” to specify clock cycles in a frame. This is independent of data packet size and can range from 0-128.
Once the I2S trigger is defined, click “OK” to return to the grid.
Custom
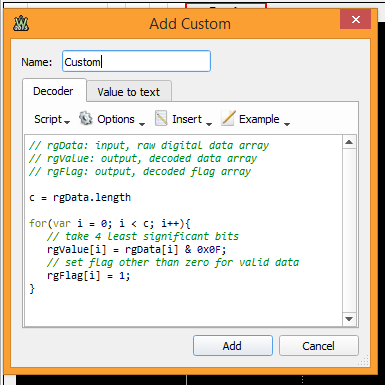
The last protocol option is Custom, which lets you define your own protocol interpreter.
Waveforms is coded using JavaScript. Utilizing the SDK that downloads with Waveforms, custom applications can be built and included with your own installed version of the Waveforms application. For more on that, see the SDK PDF that downloads with Waveforms 2015 and the Waveforms reference manual.
Step 4: An Example
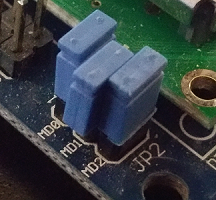
We've talked about showing an example several times now, so let's get to that. The Pmod CLS is a great device to use for this example because you can communicate with it using SPI, UART, or I2C. For this example, we'll use UART, and from the reference manual, we know that with CLS revision E (found on the underside of the PCB), we need to set the communication selection jumpers like so:
There are two 6-pin Pmod headers on the CLS, J1 and J2. The silkscreen on the bottom shows the different communication protocol connections.
Since we're using UART, we will need to use the RX pin on J2. We won't be expecting to receive data from the CLS, so the TX pin doesn't need to be connected. Also on J2 are the SCL and SDA pins for I2C communication. Use J1 for SPI communication. Both J1 and J2 have 2 power (V and G) pins for powering the Pmod.
Using a 6-pin MTE cable, connect the CLS to the ChipKIT board. The image shows a uC32.
Be sure to connect the RX pin on the CLS to the TX pin (1) on the uC32.
The CLS has a number of commands in the user guide that can be used for some basic set up. Once that is done, you can start sending text to it. The following code is a very simple example of this.
// ASCII values are in HEX, but can be converted to chars by typing a single apostrophe (')
// before and after the char, e.g. '['. Note that 'ESC' won't work.
byte setup_display[] = {0x1B, 0x5B, 0x6A, 0x1B, 0x5B, 0x30, 0x68, 0x1B, 0x5B, 0x32, 0x63};
                      // ESC,   [,    j,   ESC,   [,   0,     h,   ESC,   [,    2,    c
byte clear_display[] = {0x1B, 0x5B, 0x6A};
                      // ESC,   [,    j
void setup() {
  Serial.begin(9600);
  while(!Serial){};
  Serial.write(setup_display, 11);
  Serial.write("Hello World. How are you today?");
  delay(1000);
  Serial.write(clear_display, 3);
  Serial.write("I'm fine, thank you.");
}
void loop() {}
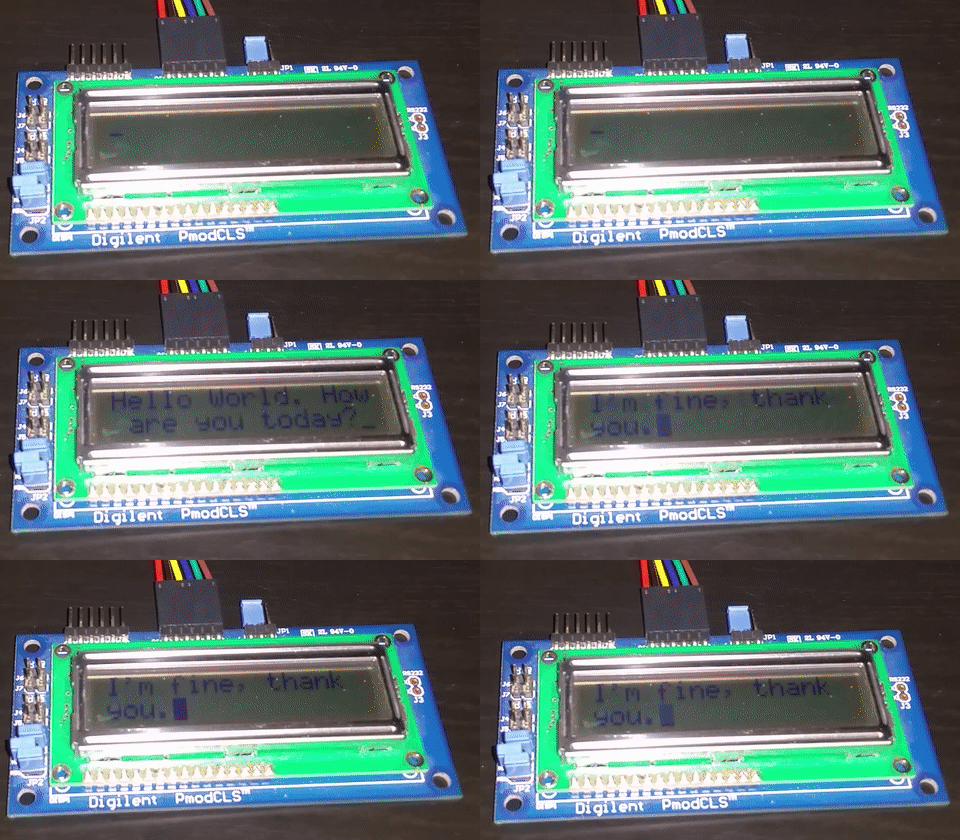
Download the code to the uC32 and the messages should display on the LCD.
Utilizing a mini grabber test clip, you can piggyback on the uC32 TX signal to analyze it with the Logic Analyzer. Be sure to also connect one of the AD2 GND wires to a GND pin on the uC32.
Set up a UART protocol interpreter with the Logic Analyzer tool. The default property settings will work fine here.
Click on the “X” in the trigger column and select “Fall”.
The UART data line holds logic high when not in use. The start bit of the data frame is indicated by dropping the line to logic low, so we know that we are about to get a data packet when the line goes low and the tool will trigger on that first falling edge.
In the “Trigger” box, select Normal so that the tool wil wait for the trigger and not automatically begin acquiring data.
At the top right of the plot window, enter 4.5 ms in the “Position” box. This will center the plot at 4.5 ms, shifting 0 ms to the left to allow us to see more data.
Click “Single” and the tool will wait for the trigger condition to be met, indicated by the status indicator “Armed”. Reset the microcontroller to begin sending serial data on the TX line. The tool will trigger and acquire 9.5 ms of data.
We can see that the analyzer correctly interpreted the data packets and the hex value along with the ASCII character is displayed along the top.
The only problem is that we know that we sent a lot more bytes of data than the 9 we can see in the plot. Using the record function, we can capture the entire data stream. Let's look at that.
Select Record from the “Mode” box. The plot will likely resize, but don't worry the data is all still there. Save it, export it, whatever, but we'll get another sample in a minute.
Click “Config” to configure the record function. A configuration window will open.
Our serial baud rate is set at 9600, which is essentially 9.6 kHz. We want the sample rate to be significantly higher than that in order to capture the data. The default “Rate” should be 200 kHz, but any value higher than 10X baud is fine, just don't go to high or you won't have enough samples in the buffer to record enough data for the time required.
Set the number of “Samples” to determine how long the tool will record. Multiply your rate by the time required for acquisition to get you samples. In this case I already know that the uC32 is finished transmitting data to the CLS after about 2.5 seconds, so with a rate of 200 kHz, that leaves me with 500,000 samples.
“Base” is set by the tool in this case, so don't worry about it.
Use the “Position” box to set the position on the plot of the first sample. 0% is far left, 100% is far right, and 50% is right in the middle. For this example, set it to 5%.
Once everything is set, click “Start” to begin acquisition. The tool will buffer a few samples and then wait in “Armed” status. Reset the uC32 to begin transmitting to the CLS. The plot should look like Fig. 195 below once it finishes.
It doesn't look like much, but luckily we recorded it, so we can zoom in to see the data stream.
Use the scroll bar above the plot window to move left or right through the recorded data plot.
Notice that the data packets have been interpreted by the tool and both the hexadecimal and ASCII values are displayed at the top of the plot window.
Click on the “Hot track” button at the top right of the plot window. Zoom in on the recorded data stream and hover the mouse over it. Measurements and associated labels will appear on the plot, showing information like the data pulse width, period, etc.
Step 5: That's It!
As you can see, the Logic Analyzer on the Analog Discovery 2 is a powerful tool for helping test and analyze digital communication protocols.


