

LabForms works with LabVIEW 2014 or newer, and it allows you to connect an Analog Discovery 2 USB oscilloscope to LabVIEW. The LabVIEW code uses the LabVIEW driver for the Analog Discovery 2, which lets you access the Analog Scope and Waveform Generator (WaveGen) functionalities of the Analog Discovery with LabVIEW.
Waveform Generator Comparison
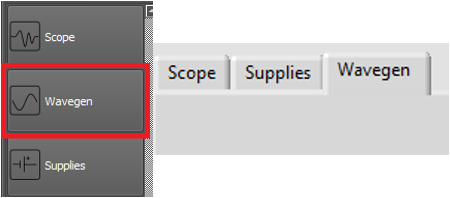
The Arbitrary Waveform Generator (or WaveGen) generates electronic waveforms. The resulting waveforms can be input into a device being tested and analyzed with the Oscilloscope as they progress through the device. This is useful for confirming the proper operation of the device or pinpointing a fault in the device. Accessing the Wavegen is easy in both WaveForms and LabForms. In both versions, simply navigate to the “Wavegen” tab from the home screen, shown below.
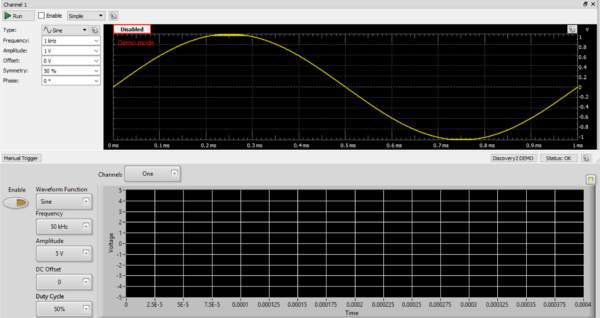
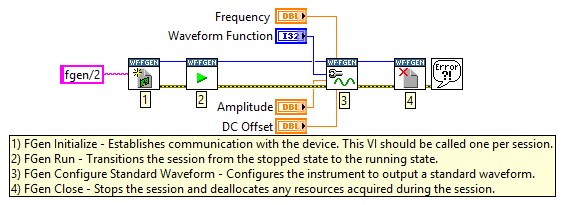
The user interfaces are quite similar. This can be seen from the picture below. LabForms contains many of the same major functions but doesn’t have all of the options as WaveForms. For example, WaveForms (shown in the top graph in the picture below) allows you to set your signal type to DC, Sine, Square, Triangle, Ramp-Up, Ramp-Down, Noise, Trapezium, and Sine-Power. Only the first 4 signals are included in the LabForms version. There are also several other differences between the two versions. WaveForms includes a large assortment of built-in features, including a signal shape editor, a data file importer, a modulation configuration mode, and many others. LabForms has only the basic features built in, but because it is built with LabVIEW, users have access to a huge amount of tools to help create customized waveforms. Below you can see the basic LabVIEW VI’s for outputting signals from the arbitrary waveform generator.
Oscilloscope Comparison
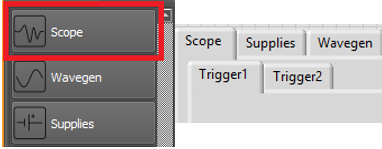
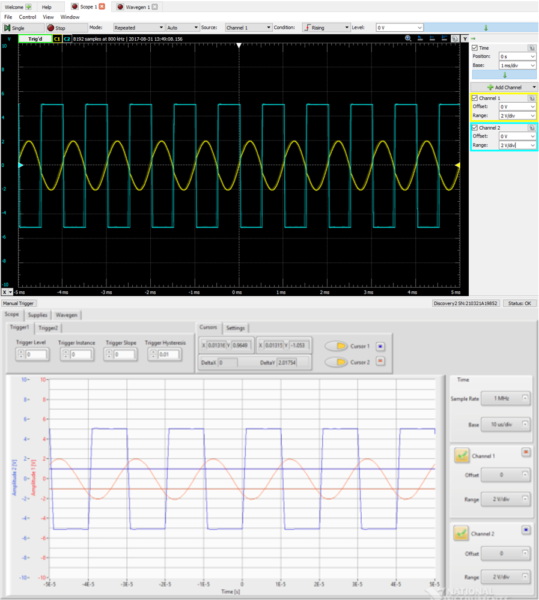
An oscilloscope (or “scope”) allows you to view a signal’s waveform, typically in a two-dimensional graph where one or more electrical signals (on the vertical axis) are plotted as a function of time or of some other voltage (on the horizontal axis). Most of the time, oscilloscopes are used to show events that repeat with either no change or events that change slowly. Accessing the oscilloscope is easy in both WaveForms and LabForms. In both versions, just navigate to the “Scope” tab from the home screen, shown below.
The user interfaces are quite similar. This can be seen from the picture below. LabForms contains many of the same major functions but doesn’t have all of the options as WaveForms. For example, WaveForms allows you to create a math channel, which allows you to perform a variety of mathematical calculations on the input signal of the oscilloscope. This can also be done in LabForms but not from the user interface. Instead, a user would have to edit the block diagram, which might be difficult for users unfamiliar with LabVIEW.
There are also many differences between the two versions. WaveForms includes a large assortment of built-in features, including reference channels, input coupling, a custom mode for filtering, and many others. LabForms has only the basic features built in, but because it is built in LabVIEW, users have access to a huge amount of tools to help create customized waveforms. Below you can see the basic LabVIEW VI’s for viewing signals from the oscilloscope.
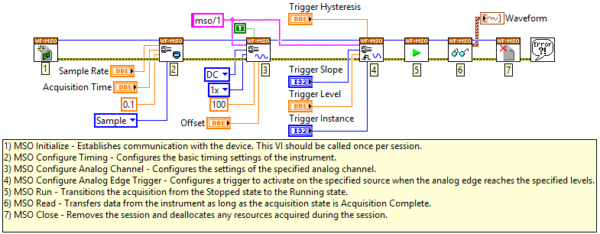
Another benefit of LabForms is the ability to be combined with the Analog Discovery 2 with other LabVIEW-compatible hardware. For example, many people prefer using physical knobs to configure a scope rather than using a mouse. That’s why I made use of LINX to allow me to control the LabForms oscilloscope with physical knobs (Pmod ENC’s). With these knobs, you will be able to control the sample rate, base, range, and offset of both of your scopes. Currently, this project can only be used with LabVIEW 2014.
Filtering Data
Raw data does not always immediately convey useful information. Often, scientists and engineers must transform the signal, remove noise disturbances, and compensate for environmental effects. For that reason, signal processing is a fundamental need in nearly all engineering applications. LabVIEW and WaveForms both give you the ability to filter data in real time.
In LabVIEW, you will filter by using Express VIs. Users can interactively explore the various analysis algorithm settings, while immediately seeing the results in the configuration dialog. For example, the Filter Express VI provides tools to configure such digital filters as lowpass, highpass, bandpass, and bandstop. The configuration dialog for this Express VI provides controls to interactively configure filter settings.
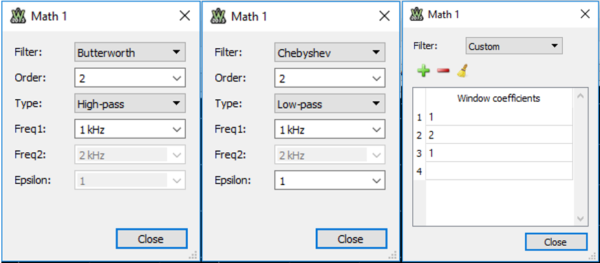
In WaveForms, you can filter by adding a filter channel to your Oscilloscope tool. Click on the Filter Button to open the settings. The Filters tab gives the option of a Chebyshev, Butterworth, or custom filter. When Chebyshev or Butterworth are selected, you can choose between 2nd and 16th order, low-pass, high-pass, band-pass, or Bandstop, and one or two cutoff frequencies. When Chebyshev is selected, you can also choose the Epsilon parameter. When custom is selected, the filter is determined from the table of coefficients.
Thank you for reading this blog post; if you want to learn more, please check out our Instructable “Analog Discovery 2 USB Oscilloscope + LabVIEW(2016 update)“.


