

How to Measure an Accelerometer Using a Raspberry Pi-Mounted DAQ
IEPE (Integrated Electronics Piezo-Electric) sensors are used to measure acceleration, pressure, or force. These types of piezoelectric sensors contain built-in independence conversion electronics used to convert the signal from the piezo sensor to a low-impedance voltage signal.
This project will demonstrate how to use the MCC 172 DAQ HAT – coupled with a Raspberry Pi – to measure the signals received from this type of sensor. The sensor used is for vibration and can be mounted in different places to monitor the condition of different pieces of equipment.
Hardware & Software Needed
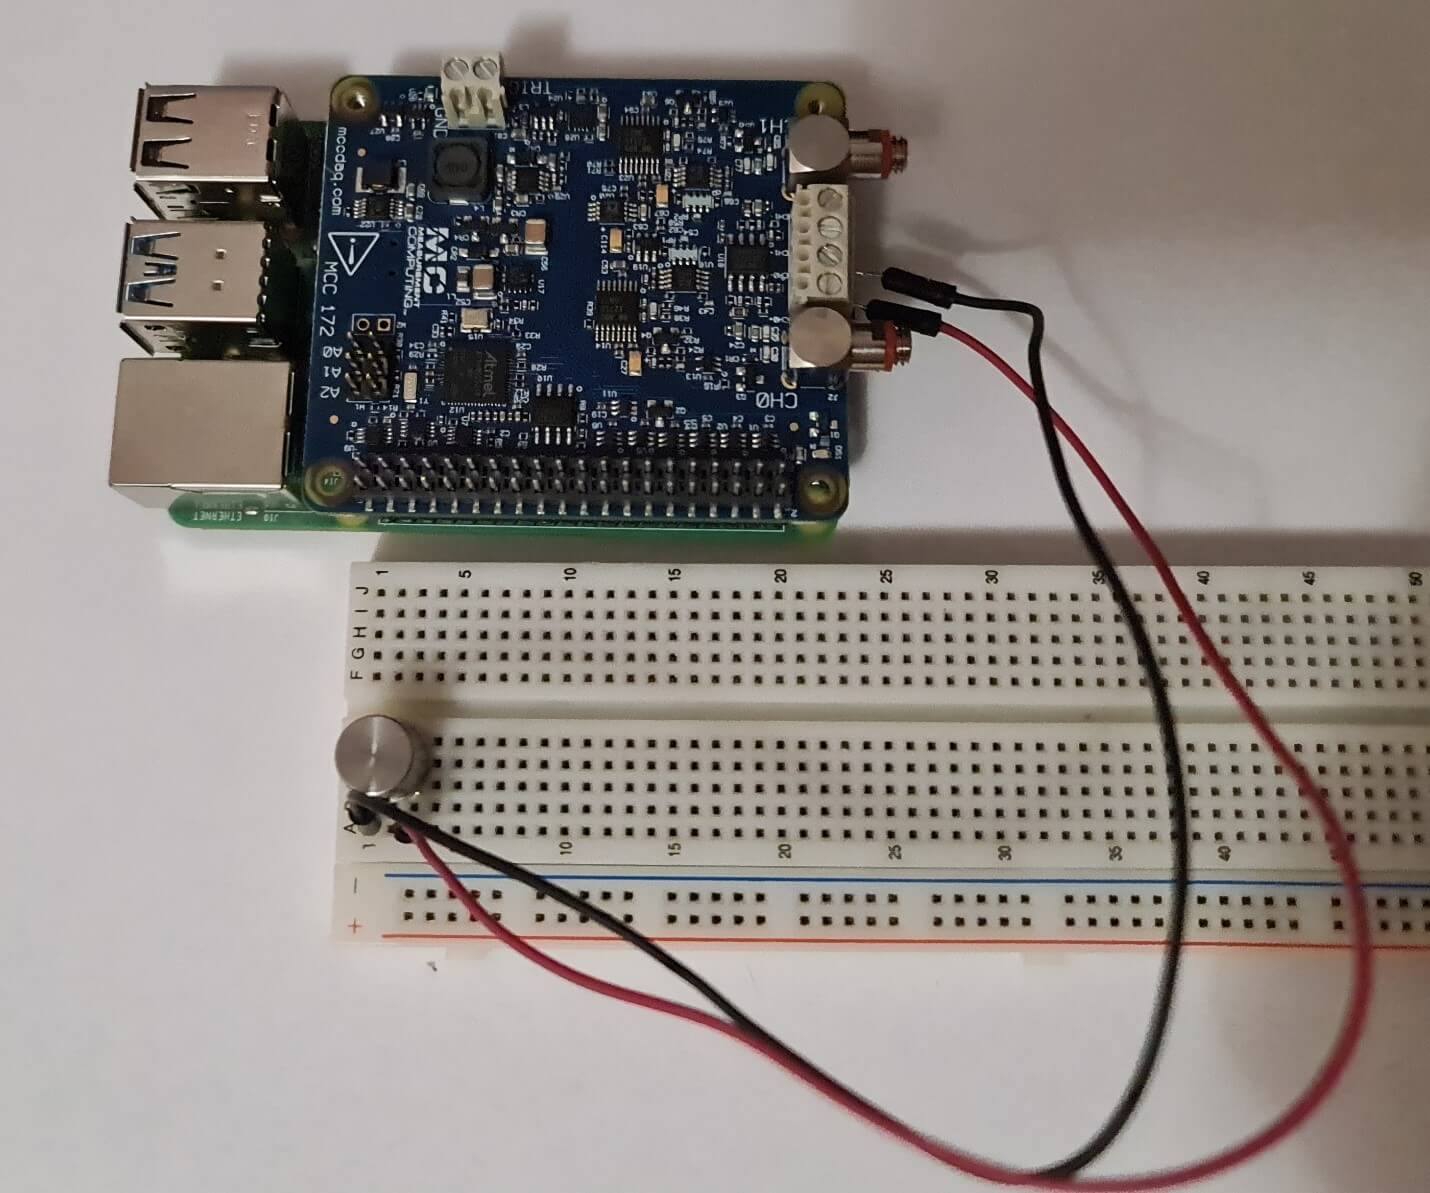
This project uses the MCC 172 IEPE Measurement DAQ HAT and Raspberry Pi to read the output IEPE sensor. The sensor use for this project is the 805 accelerometer 500G IEPE T05-3 (data sheet). A bread board and wire are used to connect to the HAT channels as shown below.
On the software side the following are needed:
Setting Up the Necessary Software
To use the MCC 172 DAQ HAT with the Raspberry Pi, the first thing to do is install the libraries provided by the manufacturer.
Here are the steps:
- Open a terminal window if using the graphical interface and update your package list:
- sudo apt update
- Optional: Update your installed packages and reboot:
- sudo apt full-upgrade
- sudo reboot
- If not installed install git:
- sudo apt install git
- Download the package offered by the manufacturer to your user folder with git:
- cd ~
- git clone https://github.com/mccdaq/daqhats.git
- Install the library. The installer will ask if you want to install Python 2 and Python 3 support.
- cd ~/daqhats
- sudo ./install.sh
To perform a firmware update or to read more information about the MCC 172 , visit the MCC DAQ HAT Library documentation.
Setting Up the Hardware
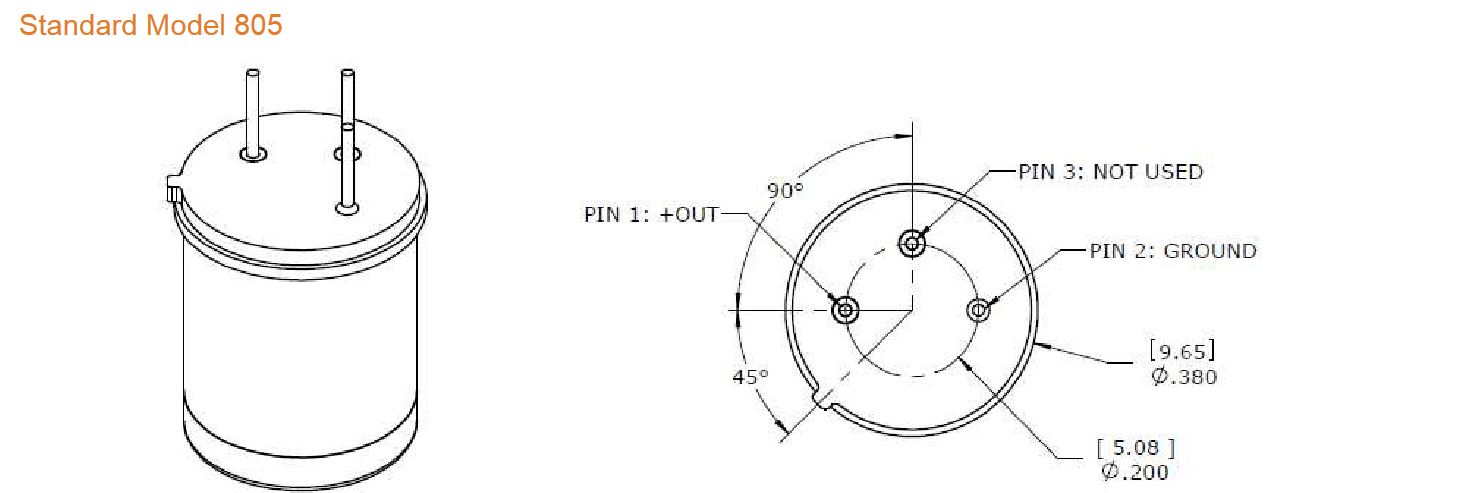
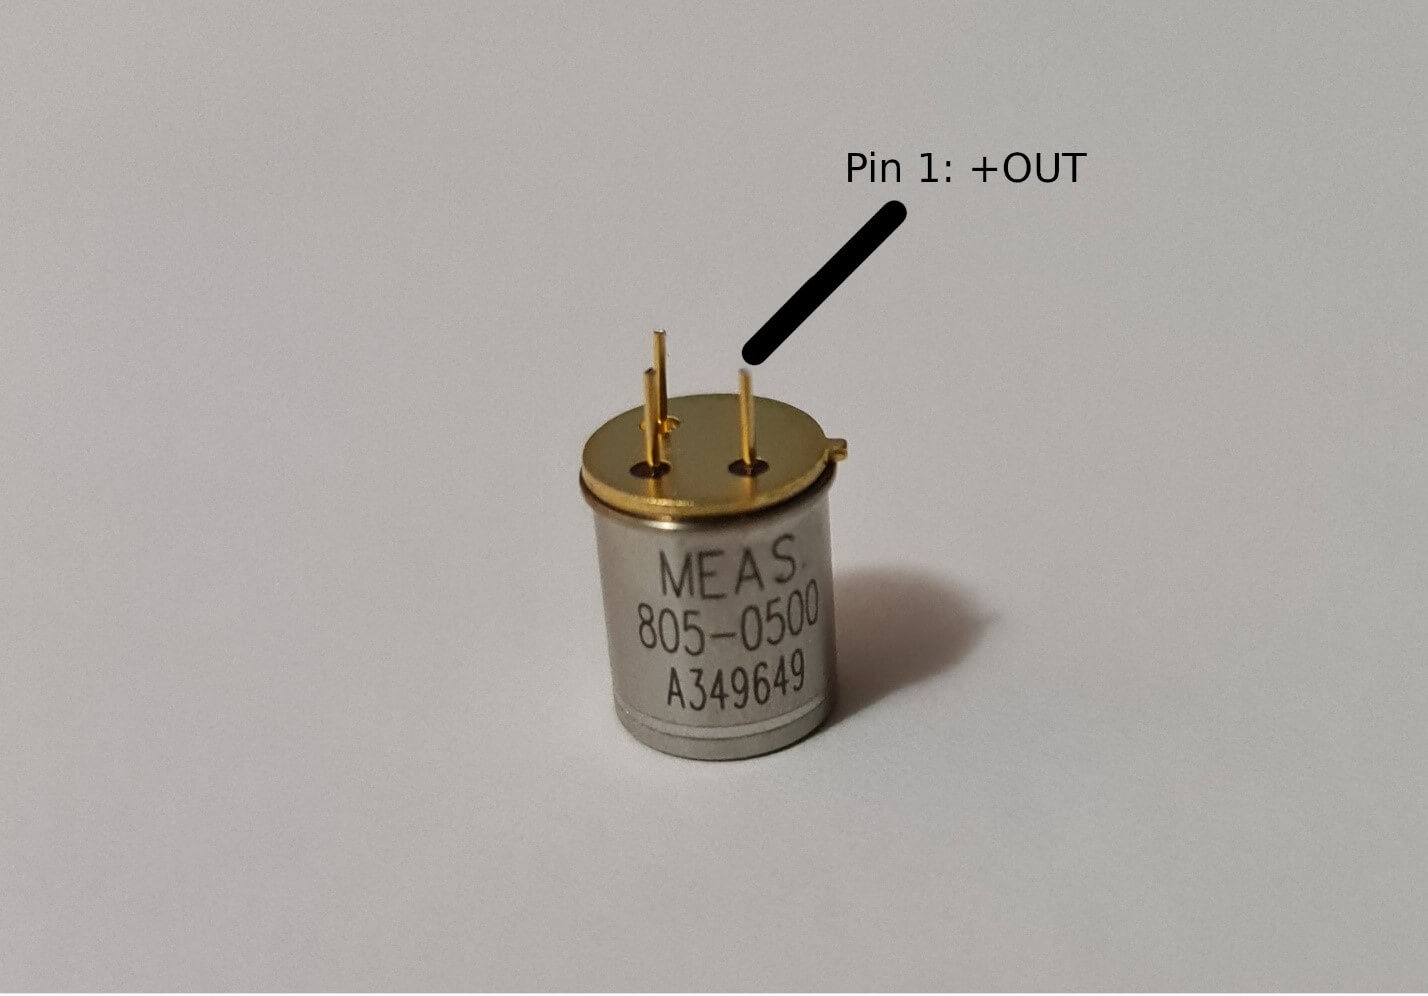
For this project, we will use an IEPE sensor. The 805-0500 from TE connectivity is a 3-pin IEPE low-cost accelerometer well suited for embedded applications that use a TO-5 header. This model of sensor has a dynamic range of 500g and wide bandwidth up to 12kHz. This sensor can be mounted using adhesive to the structure to be monitored. In this project, the sensor will be mounted using the 3 pins on a breadboard, connecting the pins to the channels from the MCC 172 for ease of use. In the manufacture datasheet, it is specifying the pin function. Pin 1 is output of the sensor, for reference the sensor packaging has a notch (as shown in the image below), the ground pin is the opposite one.
The next step is to connect the output and ground to the channel 0 input from the MCC 172. There are several types of connectors for IEPE sensors on the market, but for this sensor we will use the screw connector to securely connect the wires leading to the sensor. The code for this project is written in such a way that channel 2 is also used, if necessary, for a second sensor.
Program Flow
After mounting the components and installation of libraries, the two files attached below must be saved in the same folder. “daqhats_utils.py” is taken from the examples folder, it is in the “daqhats” folder which is installed after performing the steps for installing the libraries using git. “main.py” is the main file for this project.
- Download main.py HERE
- Download daqhats_utils.py HERE (make sure it is in the same folder as main.py)
Library Imports
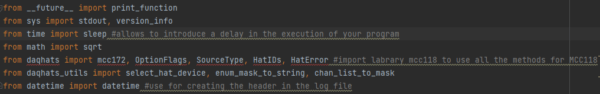
To perform the measurement, we need some functions offered in the libraries in the git repository and daqhats_utils. We import the entire mcc118 class and some help functions. “OptionFlags” is used to set the mode for scanning the values provided by the channels on the HAT and to identify the id and errors we use the “HatIDs” and “HatError” functions.
Read & Display Data
total_samples_read = 0
read_request_size = READ_ALL_AVAILABLE
dt_string = date_time.strftime(“%d/%b/%Y/ %H:%M:%S”)#convert values store in the date_tame to string
print(‘\n\n’, dt_string, file=open(‘log.txt’, ‘a’))
print(‘\nSamples Read Scan Count Channel 0 Channel 1’, file=open(‘log.txt’, ‘a’))timeout = 5.0
while True:
read_result = hat.a_in_scan_read(read_request_size, timeout)
# Check for an overrun error
if read_result.hardware_overrun:
print(‘\n\nHardware overrun\n’)
break
elif read_result.buffer_overrun:
print(‘\n\nBuffer overrun\n’)
breaksamples_read_per_channel = int(len(read_result.data) / num_channels)
total_samples_read += samples_read_per_channel# Display the last sample for each channel,in a maximum number of 12 digits.
print(‘\r{:12}’.format(samples_read_per_channel),
‘ {:12} ‘.format(total_samples_read), end=”)
print(‘\r{:12}’.format(samples_read_per_channel),
‘ {:12} ‘.format(total_samples_read), end=”, file=open(‘log.txt’, ‘a’))
# \r is use to write over the existing line# Display the RMS voltage for each channel.
if samples_read_per_channel > 0:
for i in range(num_channels):
value = calc_rms(read_result.data, i, num_channels,
samples_read_per_channel)
# Display the value number of 10 digits and 5 digits after the comma
print(‘{:10.5f}’.format(value), ‘Vrms ‘, end=”)
# save on a log file the value number of 10 digits and 5 digits after the comma
print(‘{:10.5f}’.format(value), ‘Vrms ‘, end=”, file=open(‘log.txt’, ‘a’))stdout.flush()
sleep(0.1)
print(‘\n’)
The readings are executed in a loop that continues until the user stops the scan or an overrun error is detected. All the available samples are read (up to the size of the read_buffer). Since the read_request_size is set to -1 (READ_ALL_AVAILABLE), the function “hat.a_in_scan_read” returns immediately what samples are available at the moment and the timeout parameter is ignored. The function “hat.a_in_scan_read” returns multiple elements: running, hardware overrun, buffer overrun, triggered, and timeout with all is a bool type and data that is a list of float. The data return is the one we will use next to display the information read from the buffer.
samples_read_per_channel = int(len(read_result.data) / num_channels)
total_samples_read += samples_read_per_channel
“samples_read_per_channel” is used to show the number in the data list acquired it was made and displayed. “total_samples_read” stores the total number of samples. These numbers are displayed in 12-digit format.
If there are samples in the buffer, then the program will start displaying. For each channel its result is saved to a certain value in the list, the position for each value is a multiple of the number of channels used. To display we use an index that saves for each reading the position of each sample on each channel.
f samples_read_per_channel > 0:
for i in range(num_channels):
value = calc_rms(read_result.data, i, num_channels,
samples_read_per_channel)
# Display the value number of 10 digits and 5 digits after the comma
print(‘{:10.5f}’.format(value), ‘Vrms ‘, end=”)
# save on a log file the value number of 10 digits and 5 digits after the comma
print(‘{:10.5f}’.format(value), ‘Vrms ‘, end=”, file=open(‘log.txt’,
For each value displayed in the terminal, a copy of each displayed value is saved in the log file. For this reason, after each data value is displayed, we have another print line that ends with “file=open(‘log.txt’, ‘a’))” is the function for working in Python with files, this function takes two parameters: file name and mode. “a” in this mode a file is open for appending and if the file does not exist, a file with file name will be created.
Value Display Format
def calc_rms(data, channel, num_channels, num_samples_per_channel): “”” Calculate RMS value from a block of samples. “””
value = 0.0
index = channel
for _i in range(num_samples_per_channel):
value += (data[index]* data[index]) / num_samples_per_channel
index += num_channels
return sqrt(value)
In the terminal, the buffer value is displayed as Vrms (root-mean-square voltage). The RMS value is the square root of the average value of the square function of the instantaneous values. The output of an IEPE sensor is a sine an offset between 8 and 12 V. A way to compare these values read by the MCC 172 is to calculate the RMS value. This value is easier to interpret than reading the value sent directly by the DAQ. The calc_rms function is called before the values are displayed in the terminal.
for i in range(num_channels):
value = calc_rms(read_result.data, i, num_channels,
samples_read_per_channel)
Launching the Script
To launch the Python script, open a terminal in the folder where you saved the two files with the command below.
-
python main.py
After that, in the terminal will appear the address at which the MCC 172 is located. Answer the question to enable IEPE with y for yes and n for no. After that, the terminal should display: how the HAT is set (continuous scan), the IEPE power state, the channels in use, and finally the scan rate at which it is set to work. After pressing the ENTER key, the program will start to scan. With the first run, the program will create a log file. The first line will contain the date and time when the scan is started and saved. Then in the log file it is saved on different rows the data displayed in terminal. When the program is executed again, the data will be saved in the same log file starting after the last line written previously.
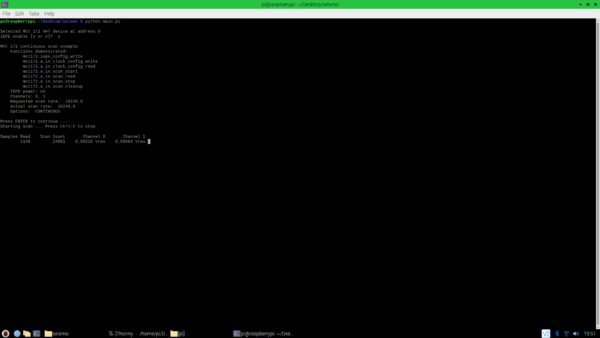
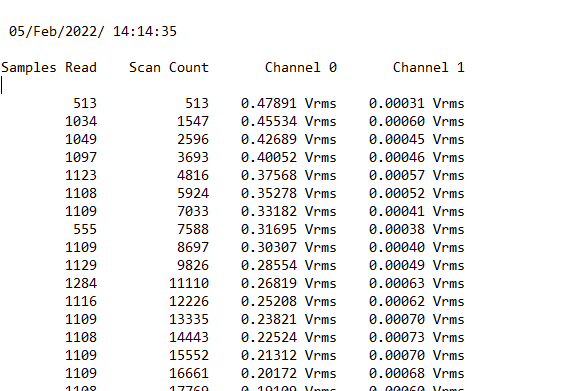
The interpretation of the display is as follows:
- Samples Read is the number of samples displayed and resets back to 0 after the buffer fills.
- Scan Count is the total numbers of the samples read, it does not reset when the buffer is full and continues to count.
- Channel 0 and Channel 1 are the value read by that channel.
Conclusion
This project is an example of how the MCC 172 DAQ HAT and can be used with an IEPE-based accelerometer to monitor sudden movements or vibrations. With the help of other IEPE sensors, force and pressure can also be monitored. The code does not need any modification to be able to use another type of IEPE sensor.
Can this Python loop example read the full speed 51kHz x 2 channels?