

I’ve always liked shock waves. Explosions. Earthquakes. And I have always wondered what kind of effect I’ve had, just walking around on the world around me.

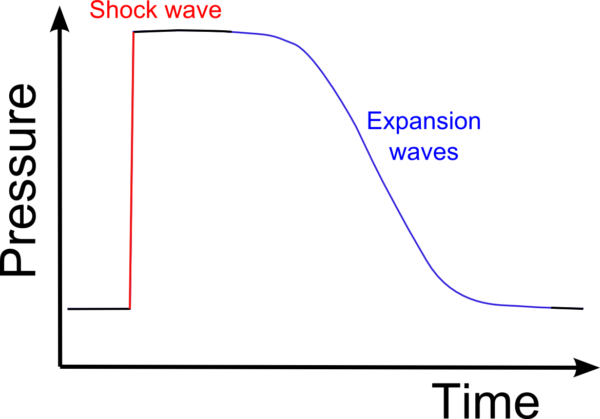
I mean…Because ocean zombies and shock waves are totally related
I also like using my Fitbit because it quantifies my movements and work-outs. Then I thought, WAIT… what about a way to quantify one of my favorite exercises – jumping.
Now I know what you may be thinking, jumping isn’t related much to shock waves and exploding things. It may not seem like it on such a small scale when us humans do it, but we still manage to make an impact.
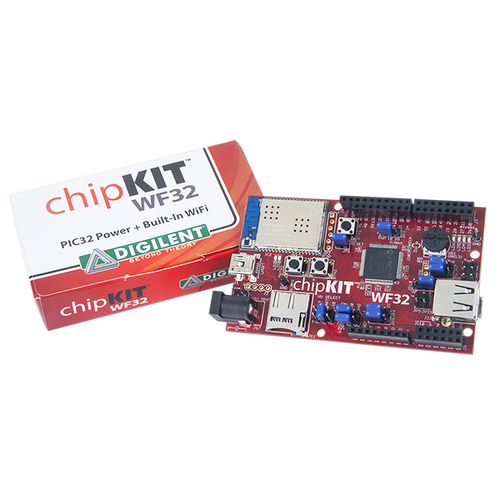
I intended to explore this interaction. Using the PmodACL2, the chipKIT WF32, and LabVIEW, I combined my interests and made a simple exercise box that measures the quality of your landing, the time in-between each jump and the force of each landing.
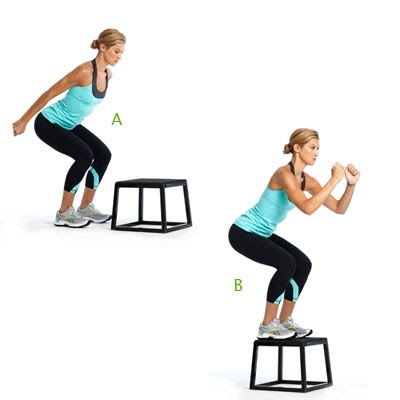
Essentially, something like this, but with electronics and…science!
Before I made the decision to use the ACL2, I first tried out a simple tilt sensor, but it didn’t have the sensitivity I was looking for.
Thus, armed only with my dream and the entire Digilent office of support and resources, I ventured into the world of Pmods. This was my first time ever using any sort of Pmod, accelerometer and/or tilt sensor. Ever. So I was pretty excited to learn and troubleshoot my way through the project.
I used a simple storage box I grabbed from home to start testing. First, I made sure the accelerometer was wired to the WF32 correctly (pictured below). There is an example in the LabVIEW example finder that is named PmodACL2, and this will walk you through how to get started taking data with your accelerometer.
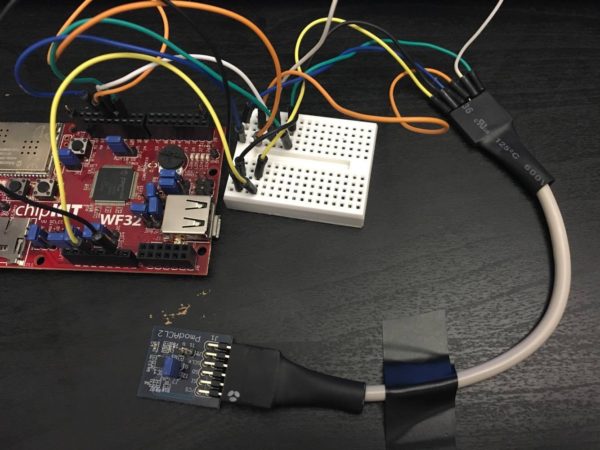
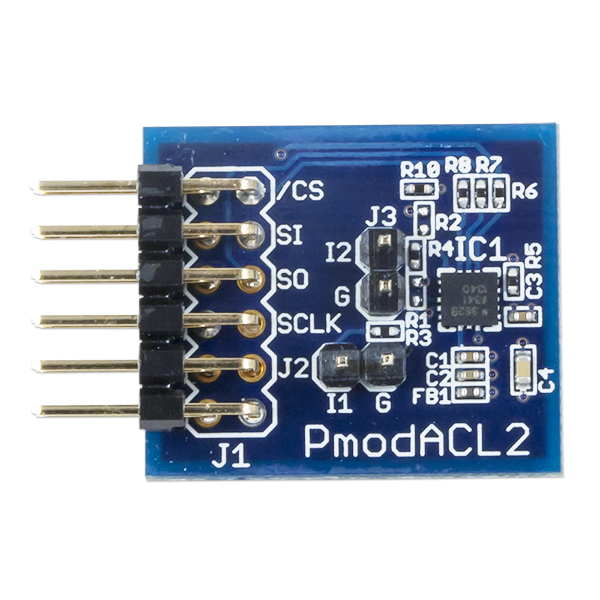
The PmodACL2 has 6 input ports – chip select (CS), master out slave in (MOSI), master in slave out (MISO), serial clock (SCLK), ground, and high voltage. The WF32 has corresponding input ports – pin #10 corresponds to CS, #11 MOSI, #12 MISO, and pin #13 corresponds to the SCLK. The Pmod uses 3.3V to connect it to the digital output of the 3.3V on the board, along with the ground port. Check out our ACL2 data sheet for a diagram and further information.
I used a small solder-free breadboard to try my best to keep the wires semi-organized. If you decide to include a second accelerometer, then the breadboard will be even more important.
The LabVIEW example program requires you to input the Serial Port, SPI channel, and CS channel in order to communicate with your WF32. The serial port is wherever your WF32 is plugged in to your computer – select something like “COM3” (though your number might be different depending on where you have it plugged into your computer).
The SPI channel should always be set to 0. Our Chip Select channel should be 10 – that’s where the CS from our accelerometer is plugged into (pin #10) on our board. Keep the resolution at 2g for now, and keep the output data rate at 100 Hz.
The accelerometer should be all ready to go at this point. Run the LabVIEW example VI and (carefully) wave your accelerometer around. You’ll see three separate waveforms – x, y, and z. I did some editing of the ACL2 example program, so don’t worry if yours doesn’t look exactly like what is pictured below.
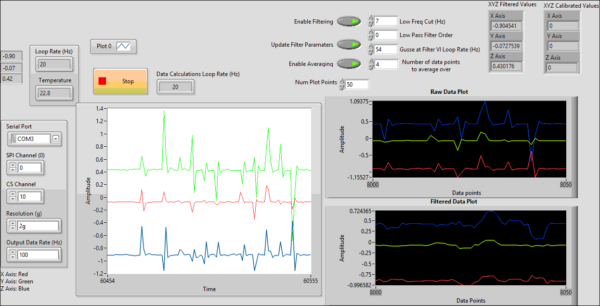
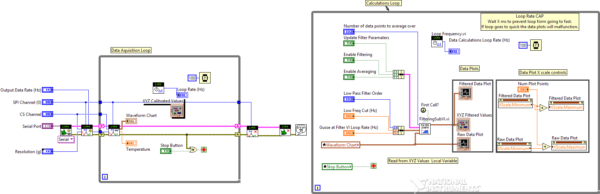
Notice how the data is pretty noisy? There are a few ways to filter that out. I merged the PmodACL2 code with the filtering code and made a few changes, and that code is right here. The reason I decided to use two different while loops – one for data acquisition and one for calculations and filtering – is because they can run on separate cores of your processor (and in turn the filter works way faster), rather than the same one.
A different representation of the raw data is in the graph on the top and the filtered data is graphed at the bottom. The biggest thing is that you can adjust how the accelerometer data is filtered. Changing the values of the low frequency cut off, Gusse filter rate, number of data points averaged and the low pass filter order make a big difference on how much noise is filtered out.
For this project, I wanted to filter out the steps of people walking around the office. This accelerometer is pretty sensitive so calibration is important to making sure you aren’t grabbing and reading data that isn’t related to the event you’re trying to look at. Make sure to play with it – adjust a value or two and run the program. Find the “sweet spot” with the smallest amount of noise while keeping a fair amount of detail in your Waveforms from the jump itself. The low frequency cut off might be the most crucial of these settings. You don’t want to cut off too much, but just enough to keep ambient noise from overwhelming the raw data.
To filter out footsteps and co-workers jokingly jumping, I have my low frequency cut off at 7 Hz, the low pass filter order set to 0, Gusse filter rate at 54 Hz, and I’m averaging over 4 data points. This does pretty well without sacrificing too much of our raw jump data.
I slowed the loop rate on the graphs to around 20 Hz in order to make it easier to read while the program is running by adding a timer into the data acquisition while loop; you may or may not want to keep it there.
As a sort of draft of our “seismic” box, I’d say this worked fairly well. I found some electrical tape and taped the WF32 to the side of my storage box, and taped the ACL2 to the removable top. Click run on the LabVIEW program and start measuring your jumps! Check out my full Instructable here!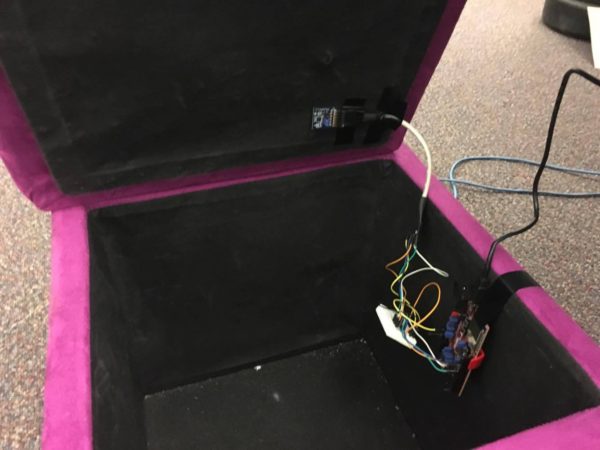
And stay tuned for updates on the project! Also feel free to let us know in the comments below, when was the last time you were inspired by science to make something cool?