Creating an Eye Diagram
An eye diagram, common in telecommunications, is a way of plotting the rising and falling edges of a digital signal in the same plot, creating an “eye”-like design. When combined with persistence, these plots are extremely useful for analyzing the properties of these most-important parts of these signals. Oscilloscopes are commonly used to create these plots, by using a clock signal synchronous to the signal of interest to trigger captures of that signal. Let’s take a look at how to create one in WaveForms, our free test and measurement software.
Why Would You Want or Need an Eye Diagram?
An eye diagram using persistence allows you to quickly identify how noisy a signal is. It does this by repeatedly tracing the measured signal path and layering it onto the same plot over and over. Ideally, a clean signal will have very thin lines, meaning your system is very consistent. If you have wider paths, this indicates that there were some inconsistencies/distortions in the data, such as jitter (rising and falling edges occurring slightly earlier or later than expected), variances in slew rate, unexpected overshoots, additional noise from sources like crosstalk, and more. Many of these issues have characteristic patterns that can be seen at a glance by an engineer with a trained eye (pun intended).
Setting Up an Eye Diagram in WaveForms
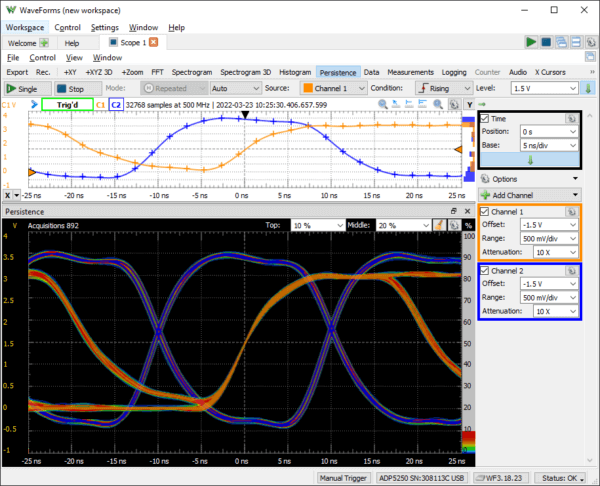
Eye diagrams can be easily created for some signals using WaveForms, by measuring both the signal of interest and the clock signal it’s synchronous to and triggering repeated captures off of clock edges. The Scope instrument’s Persistence view layers these repeated captures as previously described, and plots the frequency at which each data point occurs.
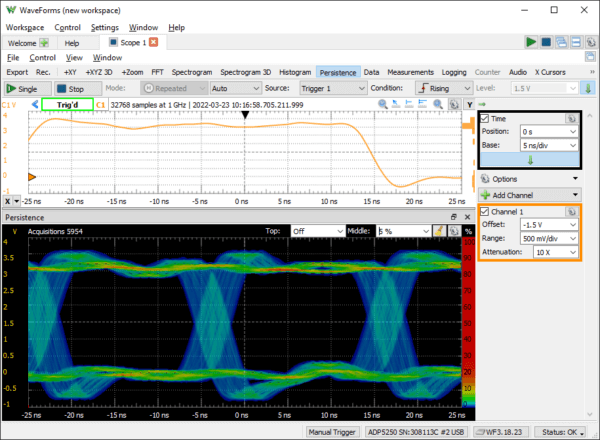
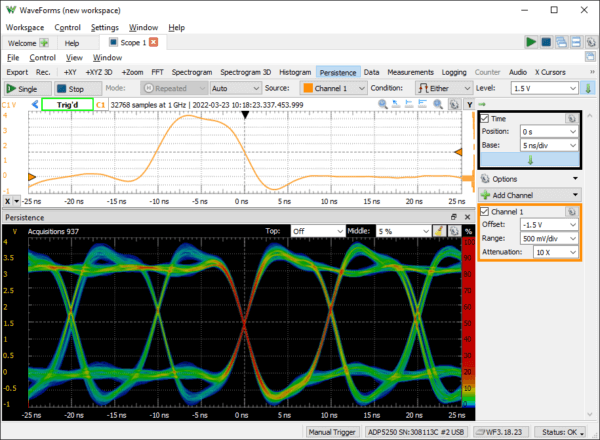
Setting up the trigger for an eye pattern depends on the kind of protocol you are analyzing, if it’s an encoded or separate clock, or if the data rate is single or double. For single data rate signals, you likely want to trigger captures centered on the clock edge (whether rising or falling) that the digital interface uses to sample the data. For double data rate signals, triggering on either edge is the way to go. Even though WaveForms currently doesn’t support the recovery of encoded clocks, persistence is still handy for analyzing these signals, and either edge triggers are still likely to get you the consistency required, even if the resulting plot will be centered on the edges of the signal of interest rather than centering on the middle of the eye.
The latest WaveForms Beta version, WaveForms Beta 3.18.23, adds a “Top” option to the scope instrument’s Persistence view, which helps to distinguish the data captured from multiple channels within the diagram., The system colors the plotted data points both by their frequency, as normal for the Persistence view, and with the color representing the channel. Only data points occurring more frequently than the chosen top setting percentage are colored by channel; to show the path most commonly taken.
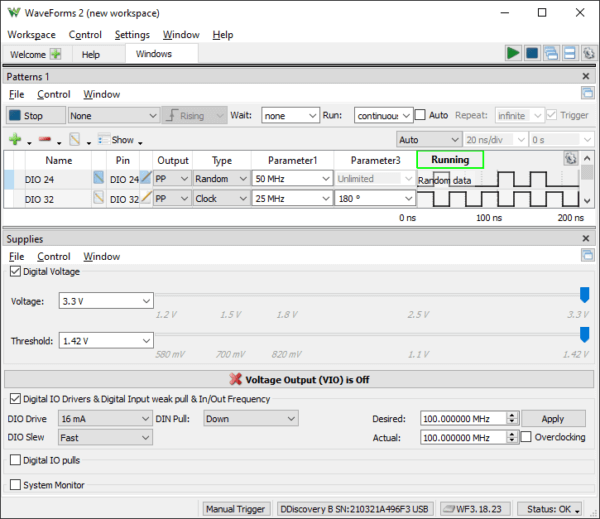
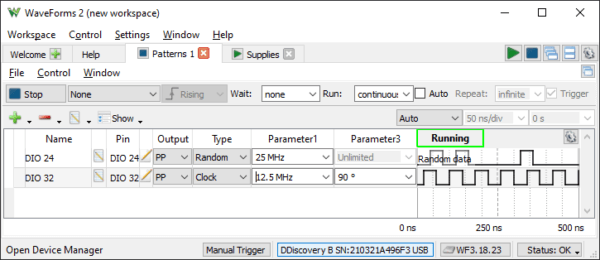
To simulate a communication system, we’ve used a separate device (the Digital Discovery) to generate the signals at different drive strengths and slew rates (which affect the rise and fall times) and an Analog Discovery Pro to measure the signals. Two devices are used to ensure that the data signals aren’t produced and consumed by instruments using the same clock – the system we’re simulating would have multiple clock sources on either end of the transmission, so we should too.
Here are a couple examples of signals generated by the Digital Discovery’s pattern generator:
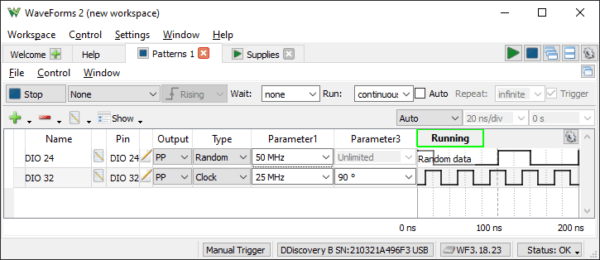
And now, lets look at some captures!