

Building a Raspberry Pi-Based DAQ System for an SAE Baja Challenge Car
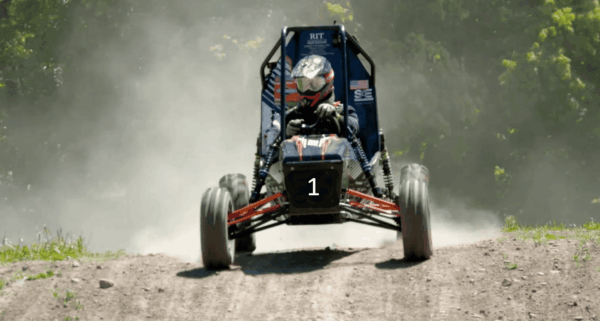
The SAE Baja Challenge pushes engineering students far beyond the classroom. Teams are tasked with designing, building, and racing a rugged, single-seat off-road vehicle capable of surviving steep climbs, rough terrain, mud, water crossings, and high-impact landings. Every vehicle uses the same engine, so success often comes down to engineering decisions rather than raw horsepower.
For the Bucknell University Baja team, one question kept coming up throughout the design process: How does the vehicle actually perform once it leaves the garage?
Drivers can describe how the car feels, but feelings alone cannot reveal how much stress the frame experiences during a hard landing, whether the continuously variable transmission (CVT) is slipping under load, or how close critical components are to their operating limits. To answer those questions, the team developed a custom data acquisition (DAQ) system capable of recording and storing real-time measurements while the vehicle is in motion.
Built around a Raspberry Pi and two MCC 128 analog input HATs, the system continuously records data from sixteen sensors distributed throughout the vehicle. These sensors monitor frame strain, acceleration, engine speed, transmission speed, and CVT temperature. After each test run, the collected data is saved for detailed analysis, giving the team objective insight into vehicle performance and helping guide future design decisions.
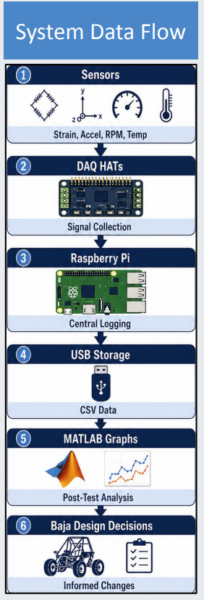 Turning Vehicle Performance into Data: The team’s goal was to create a rugged, expandable data acquisition platform that was easy to deploy on the Baja vehicle. At the center of the system is a Raspberry Pi single-board computer equipped with two MCC 128 data acquisition HATs. Each MCC 128 provides eight analog input channels, allowing the system to monitor sixteen sensor inputs simultaneously.
As the vehicle travels across rough terrain, the DAQ system continuously samples each sensor and stores the measurements to the local SD Card. Once a run is complete, the data can be exported to CSV format for further analysis using tools such as MATLAB.
One advantage of the MCC 128 platform is scalability. Up to eight boards can be stacked on a single Raspberry Pi, allowing future teams to expand the system as new measurement requirements emerge. The high-speed scanning capability of the MCC 128 also enables sensor readings to be captured nearly simultaneously, making it easier to correlate events across the vehicle.
Measuring What Matters
How much stress is the frame experiencing?
One of the team’s primary goals was to understand how much stress the frame experiences during actual race conditions. Prior to this project, peak frame stress had never been measured, making it difficult to determine how close critical frame members were to their design limits.
To define the expected measurement range, the team used COMSOL Multiphysics to model the vehicle frame and estimate the maximum stresses that could occur during operation. These stress values were then converted to strain, enabling the students to design a measurement system capable of capturing the full range of expected loads.
Eight strain gauges were mounted on critical frame members throughout the vehicle. Each gauge forms part of a Wheatstone bridge circuit that produces a small differential voltage proportional to strain. Because the bridge output is only a few millivolts, an instrumentation amplifier boosts the signal to a level suitable for data acquisition. The amplified signal is then passed through a low-pass filter located near the controller. The filter helps reduce electrical noise and provides additional signal conditioning before the signal is recorded by the DAQ system.
By recording strain during real-world vehicle operation, the team can identify heavily loaded areas of the frame, verify simulation results, and make data-driven decisions for future chassis designs.
How severe are the impacts during operation?
For many of the same reasons that frame stress was measured, the team also wanted to understand how effectively the suspension absorbs impacts. MEMS accelerometers were placed at each corner of the vehicle. The ADLX326 from Analog Devices was chosen for cost savings and compatibility with the MCC 128 voltage inputs. Other accelerometer types require specialized inputs compatible with IEPE-based sensors, and some use a digital interface. The ADLX326 is readily available and has a ±16 g range. For the initial run, only the X-axis output is recorded due to the limited number of MCC 128 input channels. For subsequent runs, another MCC 128 could be added to accommodate the Y and Z axes.
By correlating acceleration data with frame strain measurements, the team can better understand how impacts propagate through the chassis and identify areas where suspension tuning or structural changes may improve vehicle durability.
Is the transmission operating efficiently?
The continuously variable transmission (CVT) transfers engine power to the drivetrain while keeping the engine operating within its optimal speed range. If the transmission begins to slip or overheat, vehicle performance can suffer significantly. To evaluate transmission performance, the team monitors engine RPM, CVT RPM, and transmission temperature during operation.
Engine and CVT speeds are measured using magnetic pickup sensors that generate a pulse train whose frequency is proportional to rotational speed. An LM2907 frequency-to-voltage converter from Texas Instruments converts frequency into an analog voltage that the MCC 128 data acquisition system can measure. By comparing engine speed to CVT speed over the course of a run, the students can identify operating conditions where the transmission may be slipping.
Temperature is monitored with an infrared sensor mounted to the vehicle frame and aimed at the CVT assembly. Of particular interest is the transmission belt, which can reach elevated temperatures during aggressive operation. Excessive belt temperature may indicate increased friction, reduced efficiency, or operating conditions that could shorten belt life.
By analyzing RPM and temperature data together, the team gains a more complete understanding of transmission performance. For example, a period of elevated belt temperature, combined with an increasing difference between engine and CVT RPM, may indicate transmission slip. These measurements provide valuable insight into how the drivetrain performs under real-world conditions and help guide future tuning and design improvements.
Calibration and Verification
Before the vehicle ever reaches the track, the students verify each measurement channel and record sensor offsets. This calibration process ensures that the recorded data reflects actual vehicle behavior rather than sensor or circuit inaccuracies.
What Was Learned?
Initial testing confirmed that the strain-gauge system responded to applied loads as expected and that the accelerometers captured impact events. RPM measurements showed that both tachometer channels tracked speed accurately, while temperature measurements demonstrated the ability to monitor rapid changes in CVT operating temperature. Although data collection is ongoing, the system has already provided valuable insight into vehicle behavior and established a framework for future testing and design improvements.
From Dirt to Data
The Bucknell Baja team’s DAQ system transforms a race vehicle into a rolling engineering laboratory. By combining strain gauges, accelerometers, RPM sensors, temperature monitoring, and a Raspberry Pi-based acquisition platform, the students can move beyond intuition and make design decisions based on measured data.
As testing continues, the system will help future teams better understand how the vehicle behaves in real-world conditions, identify areas for improvement, and validate design changes. More importantly, it provides students with hands-on experience in sensor integration, signal conditioning, embedded software, data analysis, and system-level engineering.
When the vehicle returns from a run covered in dirt and mud, it also returns with something equally valuable: the data needed to build a better Baja car.
Meet the Team
The project was developed by members of Bucknell University’s SAE Baja team, who designed, integrated, tested, and validated the complete data acquisition system.
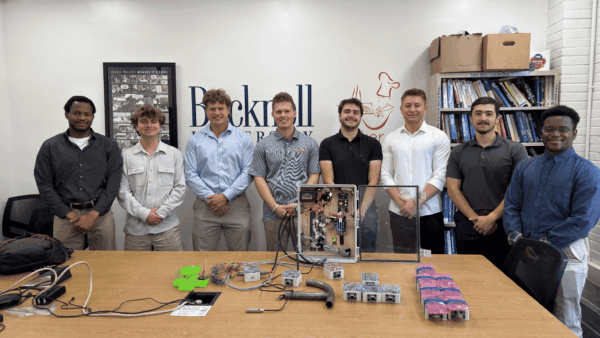
From left to right: Gardy Philogene, John Murphy, Keenan LaMontagne, Trevor Lamb, Josh Wickert, Sean Kucic, Robert English, and Davidson Theomsy.