I have returned, with another installment of the ongoing blog-series dedicated to the new WaveForms 2015 software. This time, we take a look at the Network Analyzer and how it can help you refine, tweak, and improve your projects.
I’m familiar with Bode plots and phase plots from my schooling, so I wasn’t too worried about working with the Network Analyzer. Once I reviewed Chapter 11 from Digilent’s Real Analog – Circuits 1 online classroom, I felt I had a pretty good idea of what to expect.
The behavior of circuits can be mathematically represented by at least one, if not many, differential equations. That means that at some point you can graph the behavior of the circuit. But what kind of graph do we use? Many circuit representations are perfectly fine using magnitude (V, A, W, Hz, etc.) on the y-axis, but we almost always default to using time on the x-axis. This tells us how the system changes as time passes, which can be very useful for circuits like a BJT oscillator or the temperature curve of a hacked toaster oven. These circuits often have a single value as their input, like a DC battery or even AC mains, which changes over time but at a consistent rate so as to be considered a constant. Important stuff, but in my opinion a litte boring.
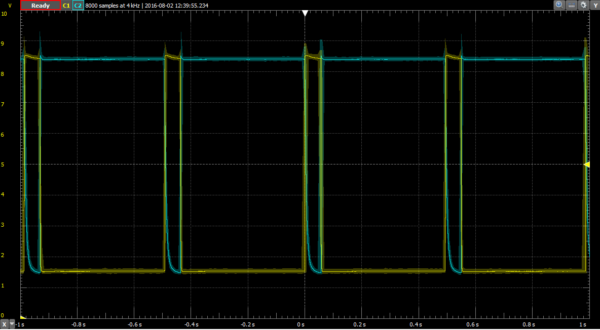
Additionally many circuits don’t care how much time has passed. The frequency of the input is MUCH more important to some circuits. Any time you use an energy storage element like a capacitor or inductor, you build complexity into your circuit. Each of these elements will have some effect on the input signal, often altering it in some way before it passes on to the next part of the circuit. Sometimes the effect is negligible, other times it can break your circuit.
Capacitors work by storing energy in an electric field between two plates of dissimilar charge with some kind of dielectric material in between them. Capacitors also have the tendency to resist rapid changes in voltage potential across their terminals. Inductors work in a similar fashion, but instead store energy in a magnetic field and resist rapid changes in the current passing through them. It is this resistance to change that has an effect on the signal passing through these devices.
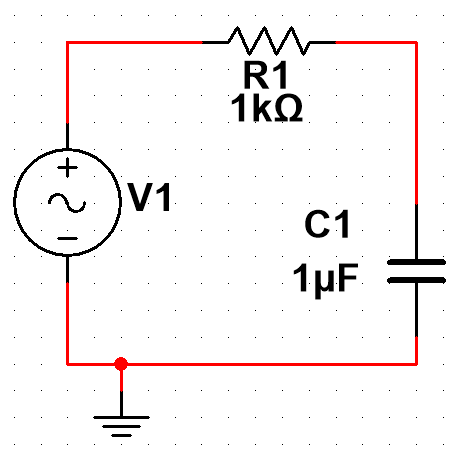
It’s very easy to see how a simple resistor/capacitor passive low-pass filter can change the input signal as it passes through to the output.
The circuit:
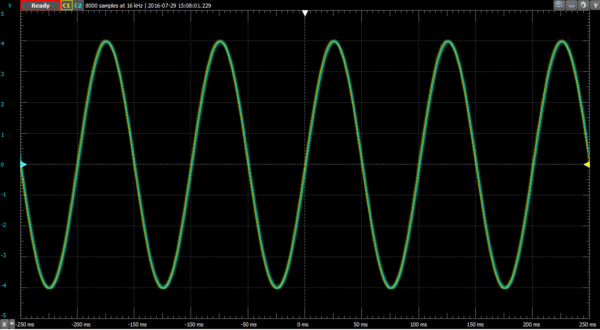
Here is an oscilloscope image at low frequency (10 Hz):
And the same circuit at high frequency (1 kHz):
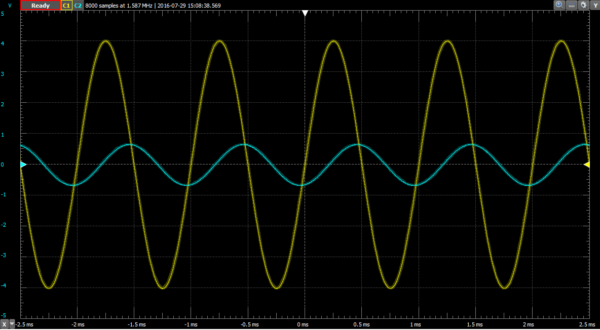
We can see that at low frequency, the output (blue) matches the input (yellow) in magnitude, phase, and frequency. At high frequency, the output doesn’t look anything like the input except for it’s frequency, which can’t be lost. Clearly the circuit is changing the input, but without checking each and every frequency in between, we have a lot of data missing. At what frequency does the input start to appreciably attenuate so as to be unusable? We can calculate it and test it with the oscilloscope, but the Network Analyzer will allow us to see all of the data on one simple plot. That way we know that our circuit is performing correctly.
Here’s the same circuit after passing through the Network Analyzer:
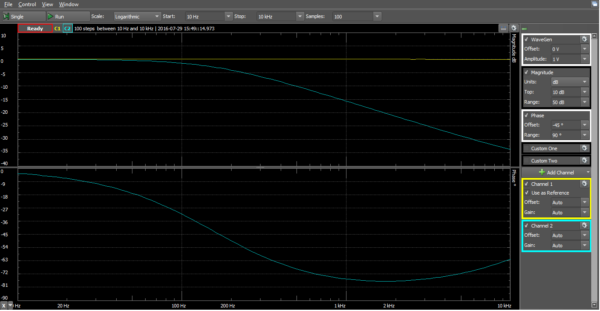
In short, the Network Analyzer allows you to look at circuit behavior in a different way. Some circuits require an understanding of how they change over time, while others are indifferent to time, requiring an alternative view.
Check out my Instructable for a simple tutorial on using the Network Analyzer with the Analog Discovery 2 and WaveForms 2015!


One Comment on “WaveForms Tools with the AD2 and EEBoard: The Network Analyzer”