

In part 2 of this series I discussed three of the hidden gems of WaveForms , including the paper and pencil icon, plot labels, and plot color. In this post I’ll continue uncovering some of the hidden gems of WaveForms .
Measurements:
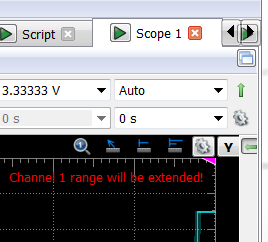
This is another one that I had no idea existed until recently. In the plot window within the gear menu there are several type of measurements you can take in the plot.
Free measurements takes a measurement between any two mouse clicks.
Vertical works the same as free except it sticks to the signals.
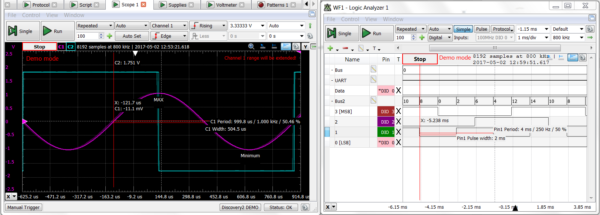
Pulse measures the pulse width, frequency, period and duty cycle.
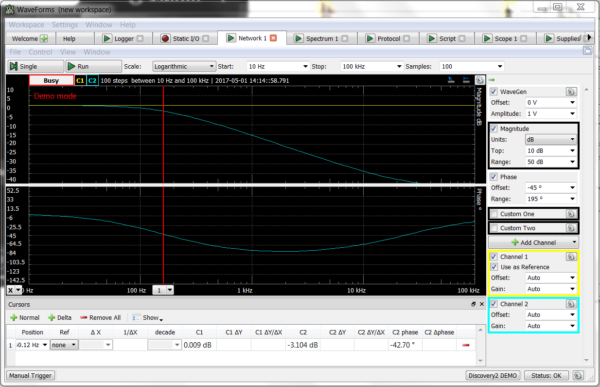
Cursors:
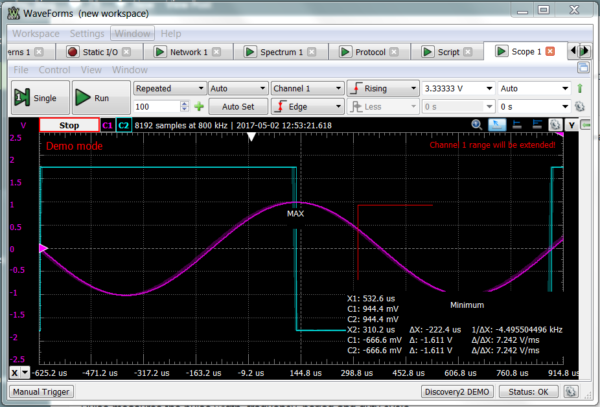
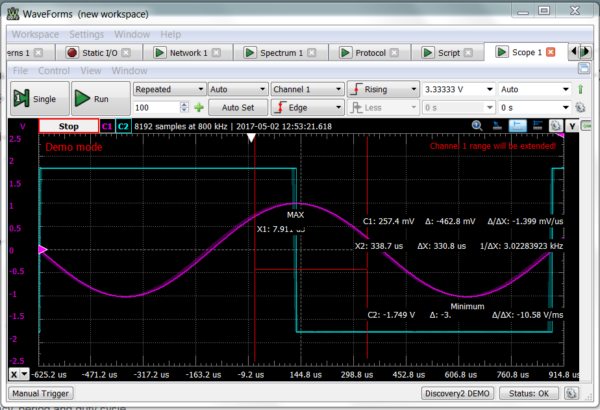
Cursors can be added from the cursor window, or from the x or y symbols on the plot window. You can add x cursors and y cursors in the Oscilloscope and x cursors in the Logic Analyzer, Network Analyzer, and Spectrum Analyzer. A single cursor will show positions on the traces.
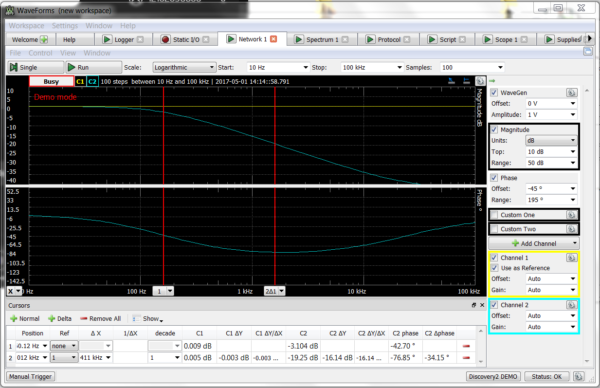
A delta cursor will show the differences between the two traces in a variety of units depending on the tool.
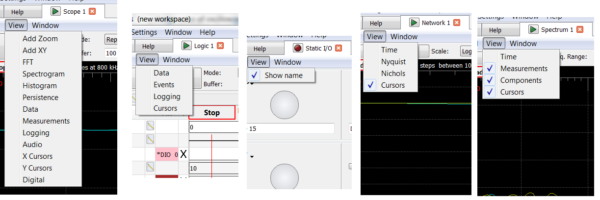
The view menu:
The view menu at first inspection might seem like it would just give you different options on how to view the data, and that would be kind of correct. It does give you different ways to view the data, but not in the traditional way. It will instead give you different types of plots and measurement tools. The options are different depending on the tool.
Now that you know about three more hidden gems, stay tuned to the blog for more of the hidden gems of WaveForms. If you’d like to see these for yourself, WaveForms can be downloaded for free!