Anyone who has spent a lot of time using LabVIEW knows how important good debugging habits are. Every LabVIEW programmer has their own personal toolbox of debugging tricks. Some of these are common, like Probes and Breakpoints, while others are probably personal things created or figured out on their own. In this post, I will go over some of the techniques I use the most often in the hope that one of them might save you some trouble the next time your code doesn’t do what you intended.
Probe Tool

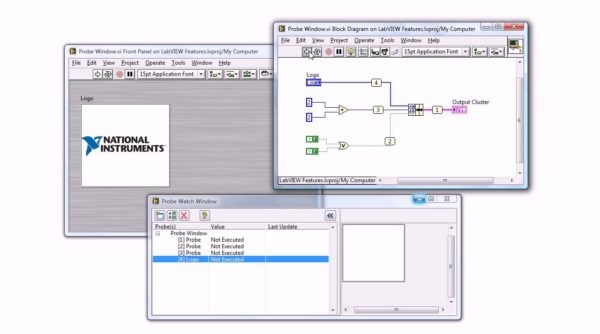
Probes are the first and simplest tools for LabVIEW debugging, but they’re deceptively powerful. With almost no extra effort, you can move beyond simply hanging a probe on a wire and increase the amount of information available as you track down problems. If data is available, the probe immediately updates and displays the data in the Probe Watch Window during execution highlighting. When execution pauses at a node because of single-stepping or a breakpoint, you also can probe the wire that just executed to see the value that flowed through that wire.
Retain Wire Values

Retain Wire Values is an often-overlooked feature of the LabVIEW development environment. When you enable Retain Wire Values for a VI, LabVIEW automatically stores the last value of every wire on the VI’s block diagram. Then, you can hover over any wire, and the probe tool will display a tooltip of that wire’s last value, even if the VI is no longer running.
Create Custom Probes

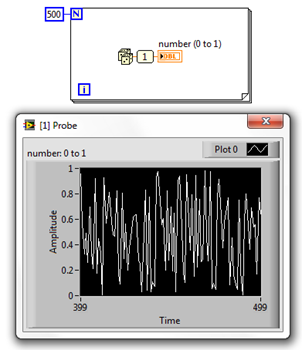
You can use LabVIEW Custom Probes to create powerful and complex debugging tools, but you can also use them without writing any code at all. For example, you can make an easy “history probe” that displays the previous values of any numeric wire using Custom Probe >> Controls >> Waveform Chart. This can help you uncover patterns or trends in data you’re probing without writing special probe code yourself.
Execution Tracing

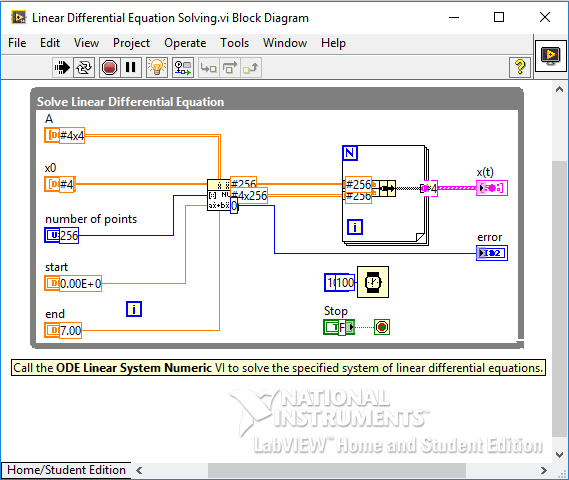
When all else fails, sometimes all you can do is trace your code step by step. When you’re faced with this kind of problem, there are several ways to trace execution in LabVIEW. The most obvious is the built-in Execution Highlighting in LabVIEW, otherwise known as “the light bulb.” If Probes are the first tool of LabVIEW debugging, the light bulb is the second.
Thank you for reading my blog post, and for more LabVIEW debugging tips and tricks follow this link. Or if you would rather watch a video, follow this link to watch Sam Kristoff walk through some basic debugging methods. If you are interested in trying out LabVIEW for yourself, you can purchase a copy of LabVIEW 2014 Home Edition which includes everything you will need to run LINX 3.0. Please comment below with any questions or comments you may have.


