

This blog post will show you how to use your Analog Discovery 2 to verify what the signal looks like from an Arduino PWM pin in LabVIEW. To do this we will use a LabVIEW VI, called LabForms, which allows you to connect an Analog Discovery 2 USB Oscilloscope to LabVIEW. The LabVIEW code uses the LabVIEW driver for the Analog Discovery 2, which lets you access the analog scope and Waveform Generator (WaveGen) functionalities of the Analog Discovery with LabVIEW.
Materials Needed
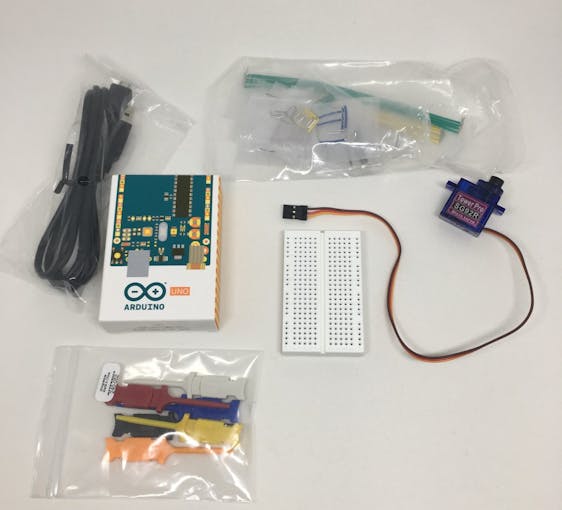
- Everything from Setup (OpenScope, micro USB, wires)
- Breadboard (from Parts Kit)
- Servo (from Parts Kit)
- Arduino
- USB-B Cable
- Mini Grabbers
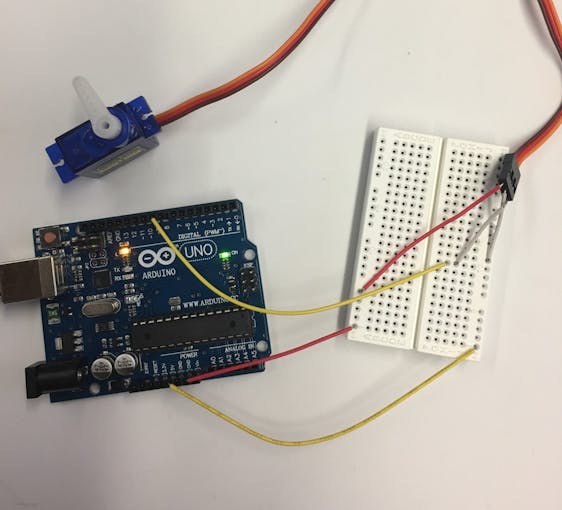
Verifying the Servo Signal
Connect your Servo to your Arduino using breadboard wires.
- Orange servo wire – Pin 9
- Red servo wire – Power 5V
- Black/Brown servo wire – GND
- The servo should be in SWEEP mode
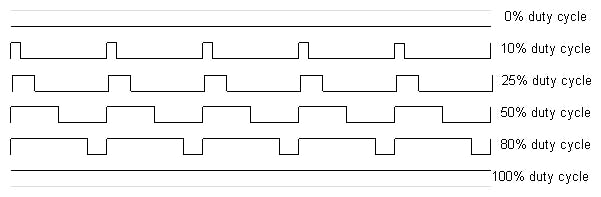
- The Arduino implements a PWM signal, that is a square wave with a duty cycle that can range from 0% to 100%.
- We will use LabForms and the Analog Discovery 2, to see exactly how long the duty cycle is on, what voltage, and duration.
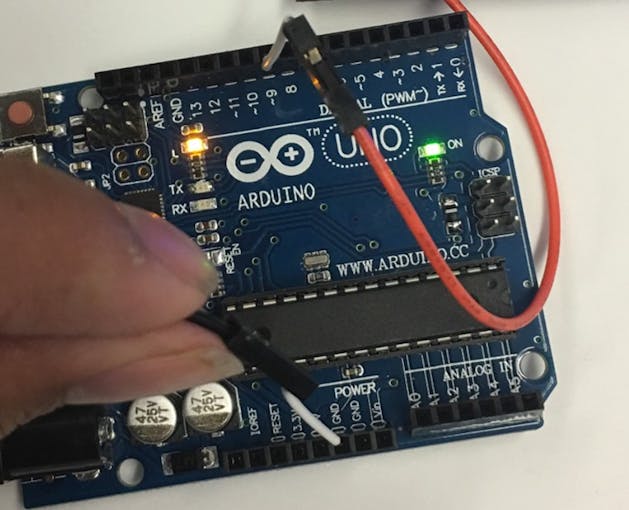
Connect the Analog Discovery 2 to Arduino
- Disconnect the Servo
- Remember, the PWM Signal for the Servo is on Pin 9 of the Arduino.
- Use a breadboard wire, connect OSC1 (Orange Wire) to Pin 9.
- Close out LabForms, open up a new window (so the settings reset to default).
- Hit Run.
Grounding the Oscilloscope Channel
- Anytime you use your Oscilloscope channel, you need to have a Ground connected. In the previous exercise when we tied AWG1 to OSC1, the signal and the scope have the same ground (the Analog Discovery 2 ground). Since the Arduino is on a different circuit, the Analog Discovery 2 needs to know its ground in order to correctly measure the signal. Let’s demonstrate this.
- Plug a breadboard wire into the Analog Discovery 2 analog ground (orange or blue with white stripe) and plug it into one of the Arduino Ground Pins.
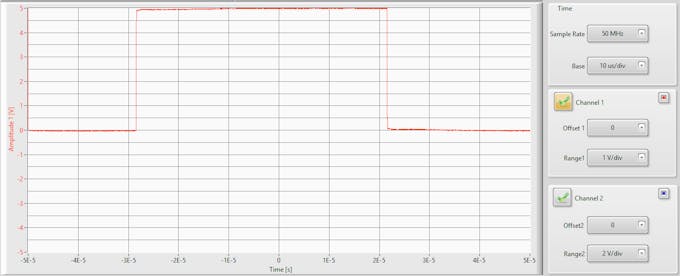
Adjust the Signal on the Screen
- The Arduino puts out 5V signals. We suggest “zooming out” so you have the signal cleanly on your screen.
- “Volts/” will allow you to change the Y Scale of the graph. Offset will allow you to move where 0 is.
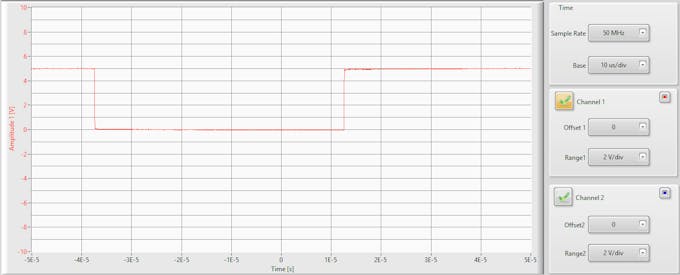
Best Fit
- It’s important to make sure that the screen is “focused” on the part of the waveform with the information we need.
- For this exercise we are interested in what happens when the signal goes high, so the top of the waveform needs to be seen.
- Change your Volts/ Division to 1.00 V and Offset to 1.5 V (you can scroll or type it in). You can also type in mV instead of V.
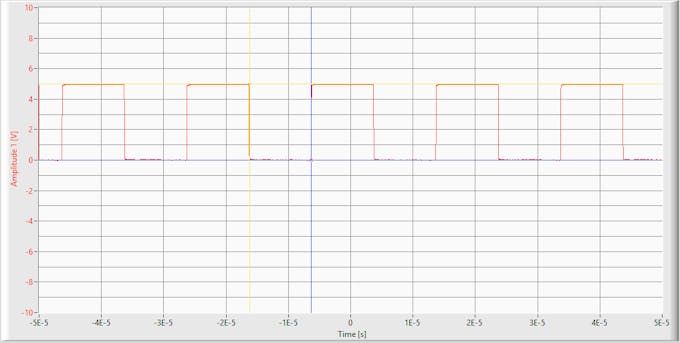
Cursor
- Cursors are a way in which you can set points of interest on a screen, and display the exact value.
- LabForms allows you to put single cursors on Time or Voltage.
- Time – We’ll use this to see if the PWM signal has a consistent duty cycle
- Voltage – We’ll use this to see what Voltage the PWM signal peaks at.
- Hit SINGLE to capture a single acquisition of the waveform
- Turn on Cursors, select Time
- Line the cursors up with the edges of the signal by moving the dotted lines at the top of the graph
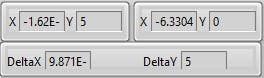
- Pay attention to the calculations to the right of the cursors button
- Follow the same procedure for Voltage
Thank you for reading my blog post; if you want to learn more, please check out my Instructable “Analog Discovery 2 USB Oscilloscope + LabVIEW(2016 update)“. If you are interested in making this project yourself but don’t have the right supplies, you can purchase LabVIEW 2014 home bundle here, and if you are a student the Analog Discovery 2 has an academic discount available. Please comment below with any questions or comments you may have!