

Welcome back to the Digilent Blog! You may have heard about how Digilent is building support for our Analog Discovery devices within the DASYLab software through a custom module. This post will go into some detail on how one would create their own custom script module within DASYLab to enable your own custom functionality.
DASYLab is a software suite that interfaces with different DAQ and Datalogging devices, letting users collect and then process the data however they need through different triggering, statistic, processing, network, and other useful click-and-drag modules.
One such module that we will be using is the Script module, which will allow us to create and run our own Python scripts, enabling custom data processing that isn’t directly built into DASYLab.
Our simple example will integrate numpy to do a bit of averaging in our custom module – yes, averaging is included by default in DASYLab already, but I did say it was a simple example. Plus if we can successfully custom process a block of incoming data and then display the results, the rest of custom processing is “just typing”. 
To get started open up a blank workspace within DASYLab.
Within the modules tab on the left-hand side of the GUI, open the Special folder and click and drag a Script module to the empty workspace.
![]()
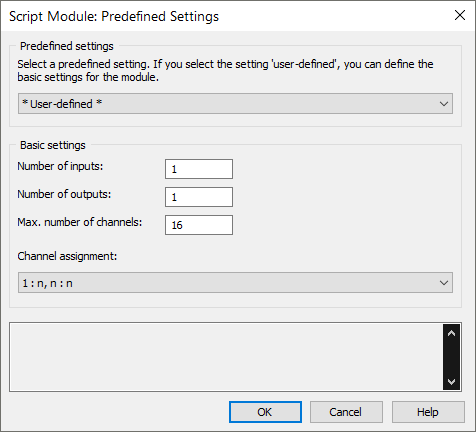
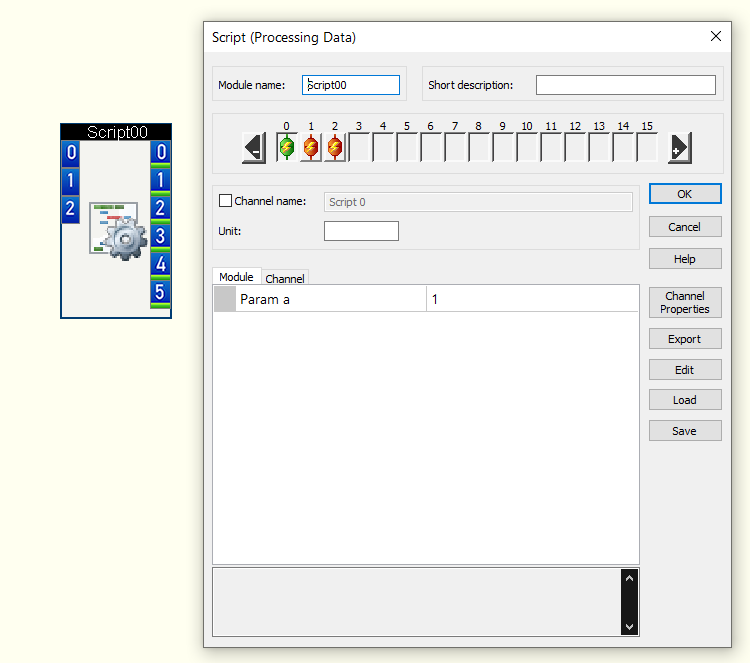
You will be immediately presented with some configuration settings for our Script Module, namely how many inputs and outputs you wish to have on the module. Let’s choose “* User-defined*” from the dropdown menu and set the module to have 1 input and 1 output. The maximum number of channels (ignoring jargon and technicalities for a moment, this can be thought as the amount of ‘data streams’ that can be processed) can be left at 16, though we won’t be utilizing more than one input channel in this demo. The channel assignment we’ll put at “1 : n, n : n”, to indicate that our one input will be going to all outputs. We’ll set up a second output to be generated off of the input within the custom module itself.
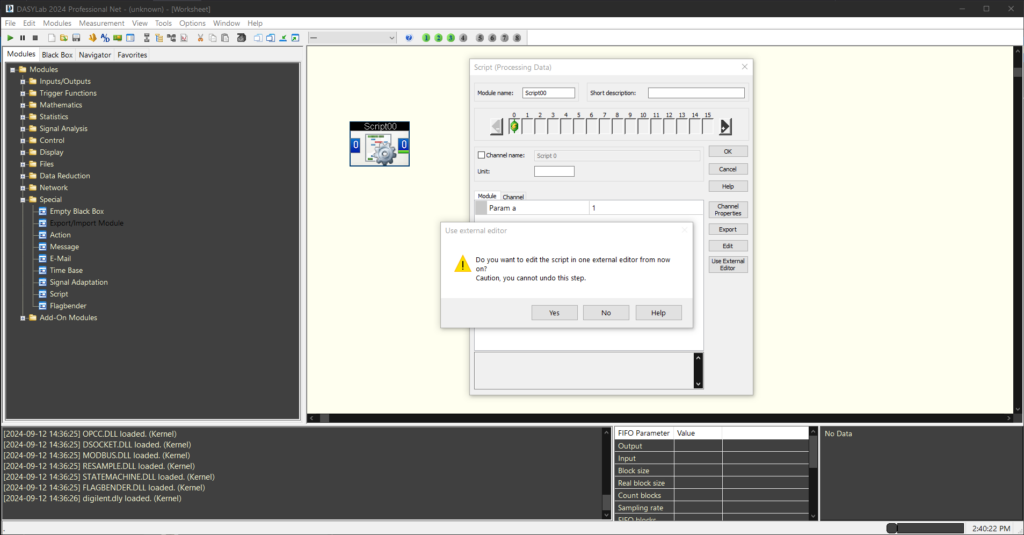
Once the Script Module is in your workspace, double click on it and choose the “Use External Editor” option. You’ll be presented with a popup that informs you that you will no longer be able to edit the script directly in DASYLab anymore, but that’s okay by us – I wanted to use VisualStudio Code, and you can use your own preferred editor of choice.
Go ahead and then click the “Save” button to name and save the script file to be edited somewhere on your computer that you can readily find. We’ll keep DASYLab open for the moment in order to be able to reload the externally edited script to test out changes, as well as to have convenient access to the built-in Help.
Open the Python script file within your editor of choice (I used VS Code). Within the default script, we will find three different classes: info, pvar, and pscript. The info and pvar classes define some variables for Script window popup for end users to set their own parameters within DASYLab to be used inside the script, but this post will not utilize this feature.
The pscript class is, of course, where we will be doing most of the custom work. The two methods that we will be adjusting are DlgOk and ProcessData, the first one to manage the number of connectors the module has when the configuration dialog’s “OK” button is pressed, and the latter to, unsurprisingly, do the data processing. Why manage the connector count? We’re going to make this block take in one set of data and output *both* an average of the input and a normalized copy of the input, on two separate outputs.
Within DlgOK, look for the comment that states “# Configure Inputs and Outputs”. Below it, there is a “self.SetConnectors” method, which intuitively (and backed up by the DASYLab Help entry) first sets the number of input channels followed by the number of output channels. As we want to have two outputs for each input channel, we’ll pass the number of channels multiplied by a scalar of 2 to the output channel count argument.
/* self.SetConnectors(self.DlgNumChannels, 2 * self.DlgNumChannels) */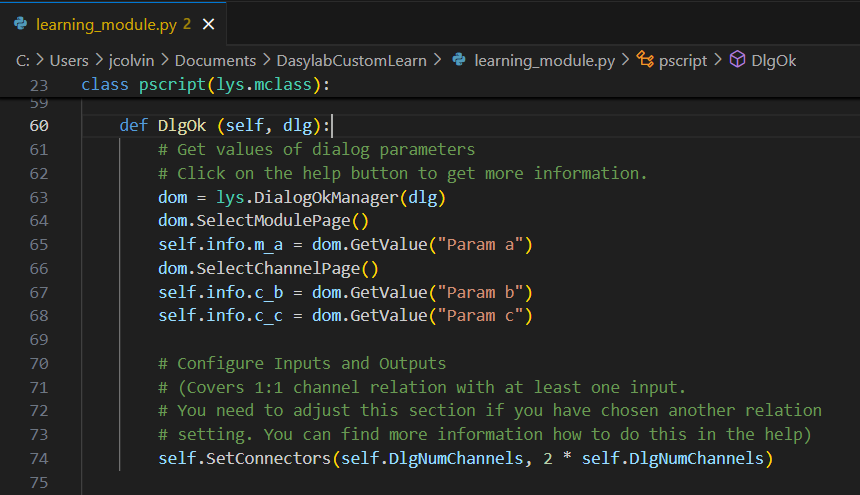
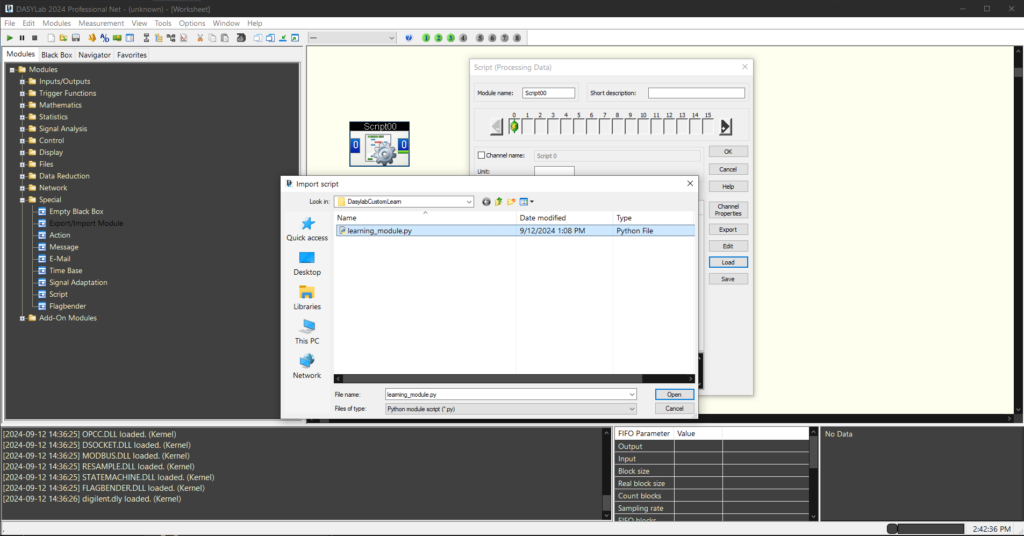
Let’s save our changes to the script and observe our handiwork in the app. Double-click into the Script module and Load the externally edited script.
After hitting OK, you’ll note that the Script module icon will change to have one input and two outputs. You can further verify our efforts by double clicking on the Script module and increasing the number of inputs and confirming your changes to observe that for every input there are two outputs. Be sure to switch it back to just one input for later.
All well and good, but now it’s time to have numpy, which is not an included Python package within the base DASYLab, do some averaging for us. DASYLab comes with its own internal Python installation, so even if you already have numpy installed in another copy of Python elsewhere on your system, you need to install it again here. Save and close the DASYLab worksheet for now as we’ll need to restart DASYLab for it to properly recognize the numpy installation for us.
Open up your favorite terminal to the python directory within your DASYLab installation and pip install numpy in order to have it match the internal python version used by DASYLab.
./python.exe -m pip install numpy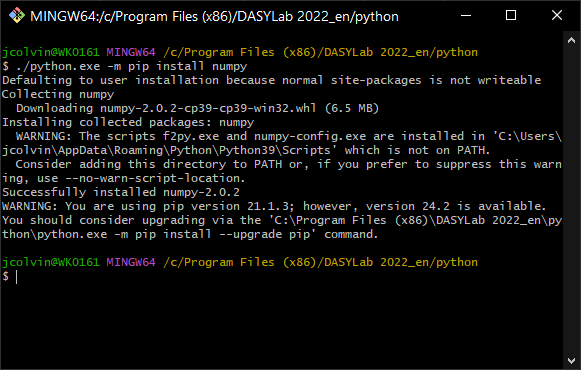
Note: because we installed numpy ourselves, this means that other people testing out our custom script will not have this dependency in their system, so they will have to do the same.
Back in our custom Python script, go ahead and add the “import numpy” line at the top of the document and then scroll down to the ProcessData method where we will do the ‘actual’ customization.
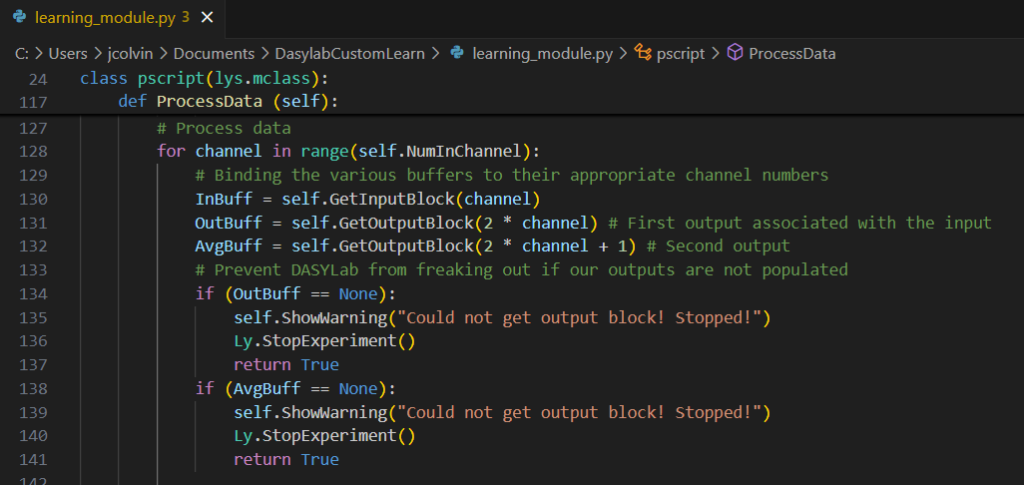
After the “# Process data” comment within the ProcessData method, there are two instance variables, InBuff and OutBuff, that are correspondingly associated with the blocks of data that are fed into and out of the Script module within DASYLab. As we’re planning to have two outputs for every input channel, let’s add that other instance variable and its error check to make sure we have its output before the code proceeds.
# Process data
for channel in range(self.NumInChannel):
    # Binding the various buffers to their appropriate channel numbers
    InBuff = self.GetInputBlock(channel)
    OutBuff = self.GetOutputBlock(2 * channel) # First output
    AvgBuff = self.GetOutputBlock(2 * channel + 1) # Second output

    # Prevent DASYLab from freaking out if our outputs are not populated
    if (OutBuff == None):
        self.ShowWarning("Could not get output block! Stopped!")
        Ly.StopExperiment()
        return True

    if (AvgBuff == None):
        self.ShowWarning("Could not get output block! Stopped!")
        Ly.StopExperiment()
        return True
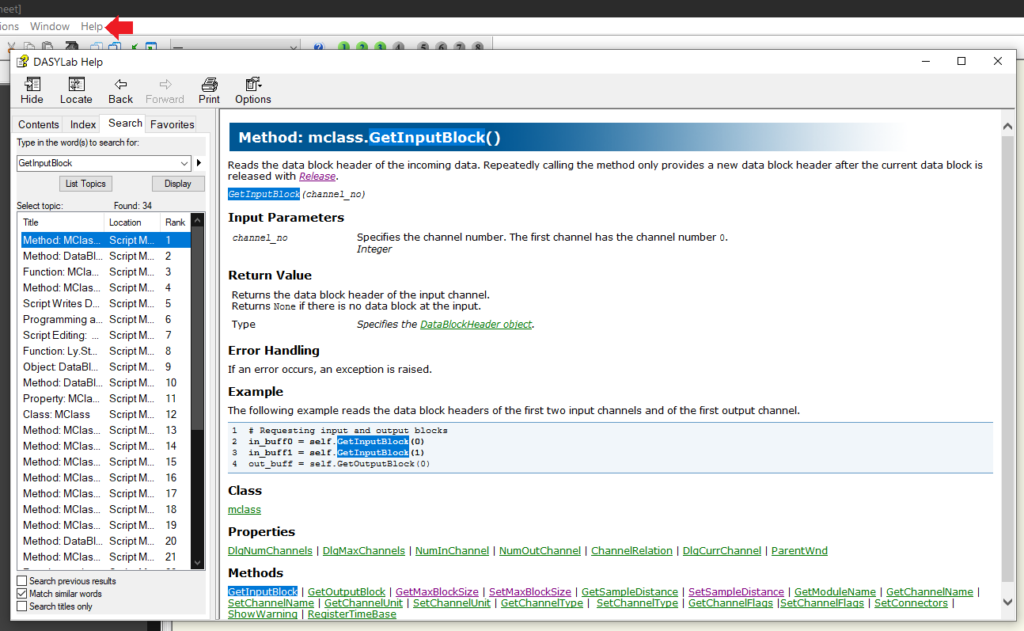
Did you know?
DASYLab has built-in documentation where you can look up any of the methods, properties, or other material within any Module. Just open up the Contents within the Help tab and search for what you are interested in!
Now we’ll add in the simple averaging calculation using numpy by summing all entries of the block of data that was supplied to our script block and dividing the total by the existing BlockSize property. For OutBuff, we will take the incoming data block and normalize each element in the list to be between 0 and 1.
Naturally, we’ll also need to any necessary clean up so that our calculated block of data can be safely handed off to whatever downstream module within DASYLab.
    # Calculate the average from the entire block of input data
    AvgBuff[0] = numpy.sum(InBuff[0:InBuff.BlockSize]) / InBuff.BlockSize

    # Precalculate the min and max outside of the for loop
    minInput = numpy.min(InBuff[0:InBuff.BlockSize])
    minOutput = numpy.max(InBuff[0:InBuff.BlockSize])

    # Check to see if we are receiving a constant value
    if (minInput == minOutput):
        for i in range(InBuff.BlockSize):
            OutBuff[i]= InBuff[i]# No normalization applied
    # If not constant, we can safely avoid divide by zero errors
    else:
        # Normalize each individual element of the input data from 0 to 1
        for i in range(InBuff.BlockSize):
            OutBuff[i]= ((InBuff[i]- minInput) / (minOutput - minInput))

    # Set the start time of the output data to start time of the input data
    AvgBuff.StartTime = InBuff.StartTime
    OutBuff.StartTime = InBuff.StartTime

    # Set the length of time the output block encompasses to the \
    # same length of time the input data encompassed
    AvgBuff.SampleDistance = InBuff.SampleDistance
    OutBuff.SampleDistance = InBuff.SampleDistance

    # Set the blocksize of the two outputs
    AvgBuff.BlockSize = 1
    OutBuff.BlockSize = InBuff.BlockSize

    # Release the DataBlockHeader of the input and output data blocks \
    # so that DASYLab knows the Script module no longer needs these blocks
    InBuff.Release()
    AvgBuff.Release()
    OutBuff.Release()

return True 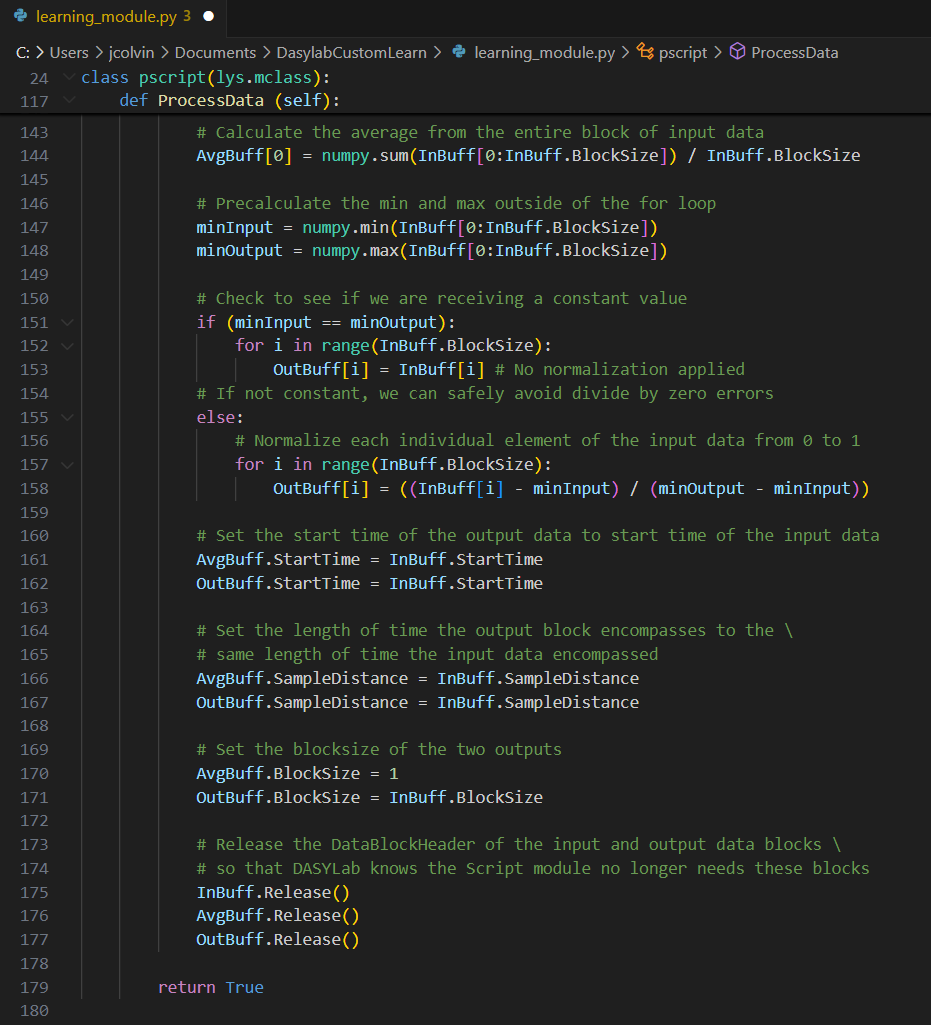
Time to test our work. Re-open DASYLab, presuming you already had it closed so that it can see the numpy installation, and open the saved workspace (or create a new one if you want to practice setting up the custom script module, I’m not your boss). If you’re using the saved workspace, be sure to reduce the number of input channels back to one, otherwise DASYLab won’t run because there isn’t any data to operate on.
Of course, nothing visually happens as we don’t have any data being generated or displayed. Add a Generator from the Control modules folder, and from Display folder add a Y/t Chart and Digital Meter to your workspace. Connect the Digital Meter to the output 1 on the Script Module (where the average is assigned), the Y/t chart to output 0, and the Generator to the input. I happened to choose a Generator with a modulated pwm input so I also added a Slider from the Control panel so I could change the pulse width at run time.
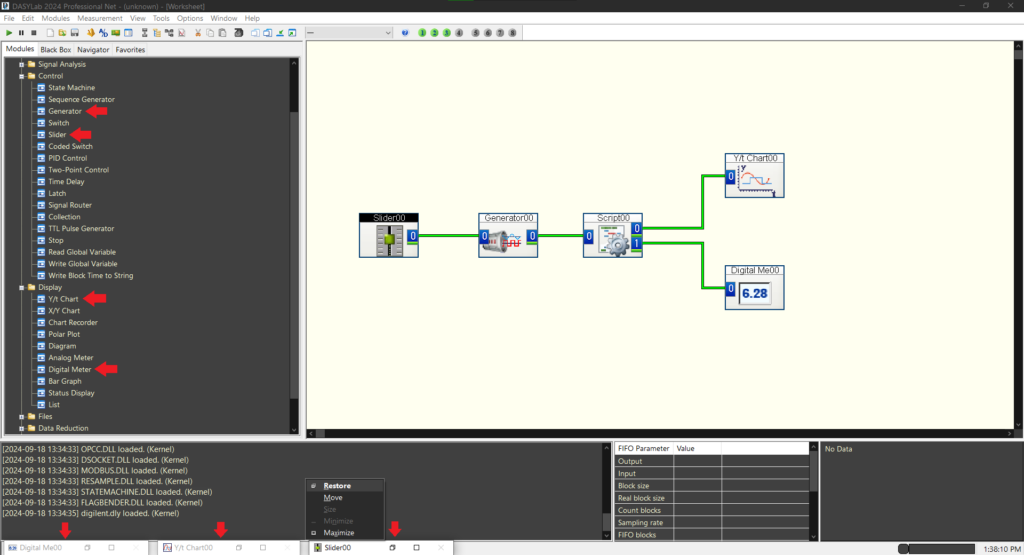
Note the new minimized windows in the bottom left corner of the GUI; these are how you will actually see your Y/t chart and Digital Meter values.
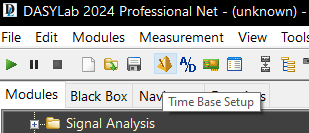
Some additional adjustments will need to be made in DASYLab in order to cleanly view our data. In the top left of the GUI, click on the metronome icon to open the Time Base Setup menu.
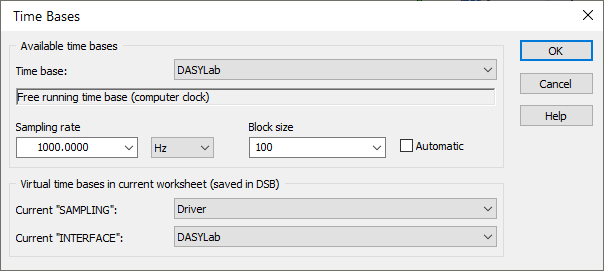
Adjust the Sampling rate to something above 10 Hz and a larger Block size. I picked 1000 Hz and a Block size of 100.
Double click on the Generator to adjust its Frequency to a larger value. I picked 100 Hz. You can also adjust the Amplitude, Offset, and Phase shift either now or at runtime. If you are using modulation, also adjust the Slider output to have more reasonable values; in my case where I am feeding the pulse width to my generator, I needed to adjust my Maximum value from 5 to 1 (as a pulse width greater than 1 will simply be cut off). The resolution lets you set how many steps there are between your minimum and maximum values.
Be sure to re-load the script you have been externally editing back into the Script Module within DASYLab and then click the green triangle in the top left corner of the GUI to run your workspace.
You’ll be able to see the Y/t chart adjusting the incoming square wave (which isn’t fully square thanks to our sampling rate and block size compared to the rate we are generating a signal at) in relation to the pulse width slider.
Congratulations! You’ve successfully created a custom script module in DASYLab using Python. By leveraging the power of scripting, you’ve expanded DASYLab’s capabilities to meet your specific data processing needs and enhance your data analysis workflow.
Ready to learn more? Explore the following resources:
DASYLab and Analog Discovery: A New Option for Code-Free Data Acquisition – Digilent Blog
Data Acquisition (DAQ) & Data Logging – Digilent Forum