

A long while back we launched the OpenScope MZ, an IoT ready instrumentation device, on Kickstarter. When we significantly surpassed our goal we set several stretch goals, many of them relating to the browser based software interface, WaveForms Live. I’m excited to announce that we’ve met those goals!
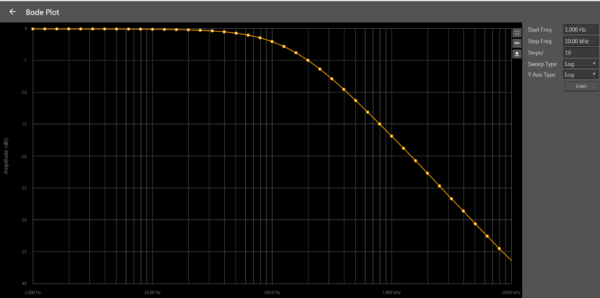
The first stretch goal was previously announced on Instagram Live and included the addition of the Bode Plot tool to WaveForms Live. This tool allows you to see the frequency response of a circuit, which is helpful when you want to quickly visualize how circuits are working in your electronics project. It uses the Waveform Generator to apply a sweep of different frequency signals, and plots the ratio of the output signal amplitude, to the input signal amplitude. You can learn more about this in Real Analog.
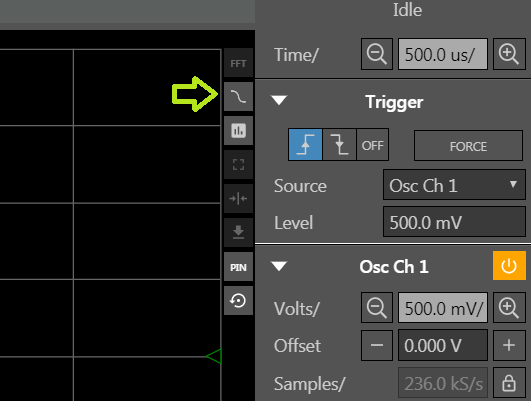
The Bode plot tool can be accessed from the instrument panel in WaveForms Live by clicking on the squiggly line icon.
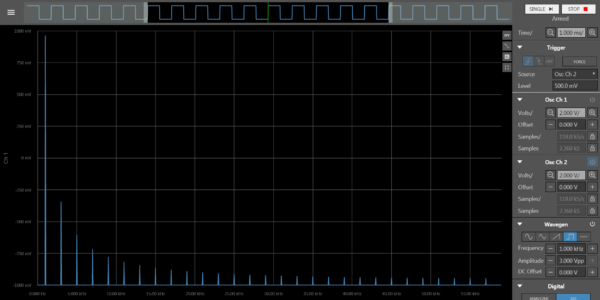
Above that you will see the FFT, where you can see the signal in the frequency domain. You can also learn more about that in Real Analog.
Below that is the newest addition to WaveForms Live and OpenScope MZ, the Data Logger!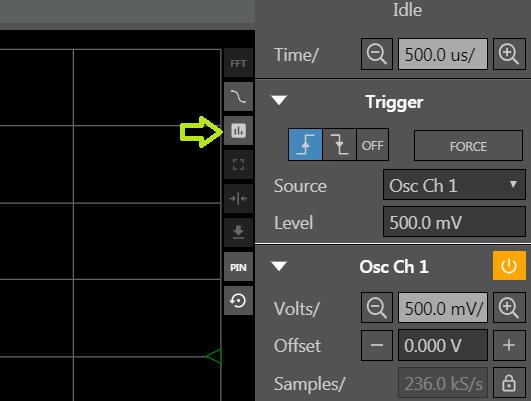
In order to access these new features you’ll need to make sure your OpenScope MZ is updated to the most current firmware. Then you’ll be able to access the data logger to stream or log data.
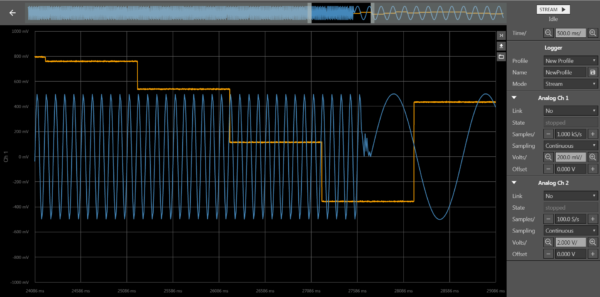
A Data Logger is designed to read data over a long period of time and log it to some sort of storage location. The Data Logger on the OpenScope MZ logs data from the oscilloscope channels, and offers the option to stream the data to the plot (as shown below), log to the OpenScope MZ’s SD card, or both.
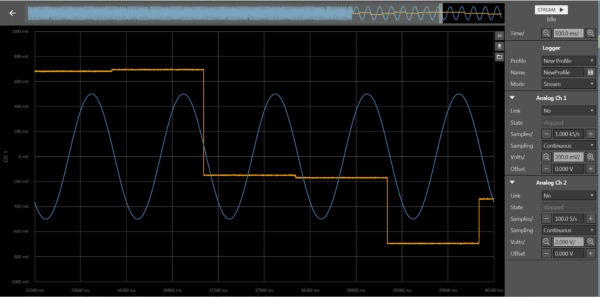
In the settings panel you can zoom in and out on the plot, set profiles, and change settings for each channel.
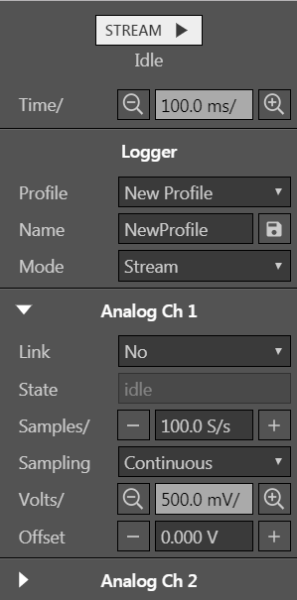
Some of the more important settings are the mode, which sets whether or not you want to stream, log to SD, or both, and the sample rate. All of these settings can be saved into a profile, which is stored on the OpenScope MZ itself.
Sample rate is an important feature when it comes to data loggers. The sample rate that data can be logged on depends on a variety of factors, including the speed of the WiFi, the USB, and the SD card you are using. The OpenScope MZ Hardware itself is capable of 50kS/s so you’ll notice that this is the limit of the field. Here’s an example of how the maximum sample rate will change in practice. When I streamed over USB on my setup, I could stream at 10kS/s for quite a while. However, when I logged to the SD card that comes in the OpenScope Accessory Kit I was able to stream consistently at 1kS/s. If you are exceeding the capabilities of your SD card, WaveForms Live will tell you. You can find a list of recommended SD cards for reaching the highest sample rates on the WaveForms Live FAQ.
One thing that’s important to note is that the faster you sample, the faster you’re collecting data, so if you don’t need the resolution it’s better to sample at a slower rate. This way you can store more data, and prevent your system from slowing down.
In these settings you’ll also find the number of samples. Sampling defines whether you want to sample continuously or sample a finite number of samples.
If you click on the arrow pointing down, you’ll open the export menu.
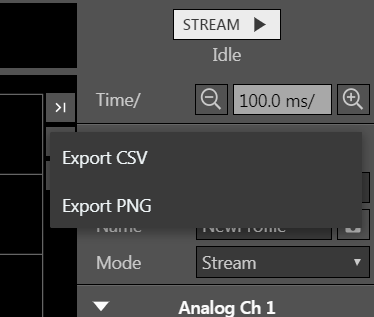
Here you can export the streamed data to CSV or the window as a PNG.
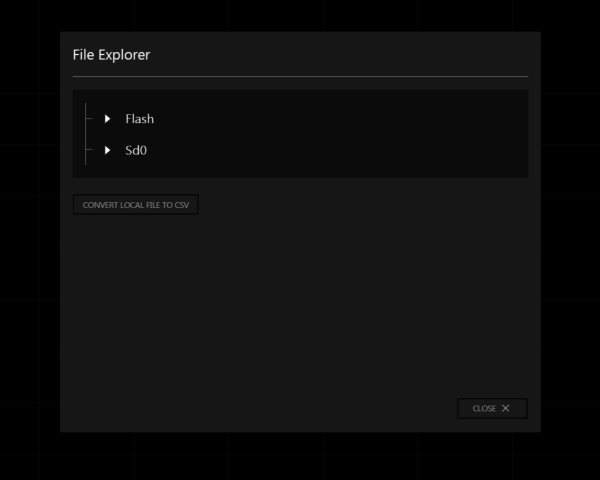
Below that you’ll see an icon that looks like a file. This will allow you to explore the files on your OpenScope MZ. You can look on the SD card and in the flash. You can also convert that file to CSV. When it’s time to download your log files from the SD card, you can use the file explorer to download then as a bin file or as a CSV as long as it is less than 10MB. Otherwise, you can take out the SD card, connect it to your computer and access the files manually.
The icon above that will move the streaming back to the front of the data that’s being logged. In the image below, I’ve moved the view to the middle of the logged data, which you can see in the bar at the top of the screen. If I wanted to go back to the data thats currently being logged, at the front of the stream, I can click the button with the arrow and line.
If you want to check out the data logger for yourself, go to WaveFormsLive.com and make sure you have the most up-to-date firmware for your OpenScope MZ.
I’m excited to hear what projects the OpenScope MZ Data Logger will be used for! If you have comments or questions about the data logger or WaveForms Live, you can talk to the developers directly on the Digilent Forum.
This blog provided lot of information about data logger