


Last week I was admiring Hamster’s project, On the Fly Fractals, which uses the Nexys Video to calculate and view a fractal known as the Mandelbrot Set. I was struck by the random fluidity of the fractals. In Hamster’s words, “it has a sort of an organic quality,” and I agree. There is a natural flow, making me feel as if I was somehow watching a living organism evolving.
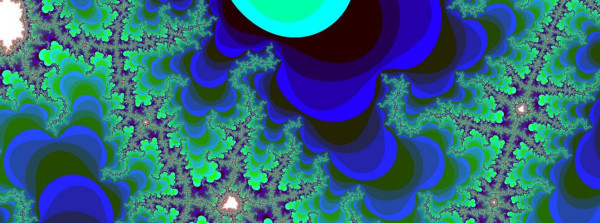
Gazing upon the changing shapes and colors nearly put me in a trance. I found myself thinking of scenes from Disney’s Alice in Wonderland, which I used to watch with my two little girls. Do you remember the “Eat Me” and “Drink Me” scenes when Alice is supersized to 9-feet tall and then shrinks to a tiny version of her former self? Zooming in and pulling back from the fractals in the video, I questioned my perception of size, just as Alice did.
While I watched the video, I imaged that I was standing on the green area, as if it was a field of tall soft grass. As the video started to roll, I was quickly whisked away into the ever-changing landscape of color, mountains rising around me. I was swept away. I was on a never-ending staircase into an ever-changing landscape. The shapes and colors enveloped me. I was Alice, somewhere in a fractal wonderland.
Intrigued, I contacted Hamster and asked him if he could break down these marvelous images for me in a “non-technical manner.” I had to hear more about this project. Thankfully he obliged and here is his explanation of fractals:
“For every point on the screen, it runs a recursive calculation, and then plots how many times this calculation can perform before the result exceeds a limiting value. This results in a self-similar object with an infinite level of detail – a fractal.”

Hanging on the words, “infinite level of detail,” I, like Alice, dove even farther down the rabbit hole. I wanted to know more.
Wikipedia has a full explanation of the Mandelbrot set. But, to put it simply, the Mandelbrot set is a set of complex numbers plotted on a standard x/y plane. The equation fc(z)=z^2+c is applied recursively to every point on the plane and colored in accordance to the results. For some points, the results of iterating that equation approach infinity. Those points are given various colors based on how quickly they approach infinity. That is pretty technical, but bear with me. The important thing is actually the points which represent numbers that never approach infinity. Some numbers, when plugged into that equation and iterated, never get very far from zero (they stay between -2 and 2). Those points are colored black.
Again, for a full explanation, see the Wikipedia page about the Mandelbrot set.
Hamster’s project uses the Nexys Video to calculate the Mandelbrot set and display it in HD in real time, which is really cool. In order to display this fractal in real time, the Nexys Video must perform around 120 billion operations per second.
Hamster explains: “As a rough idea to the range of numbers used, if the full image was the size of the continental USA, The level of magnification is equivalent to zooming down to the pixels on a HD 4″ cell phone display.”
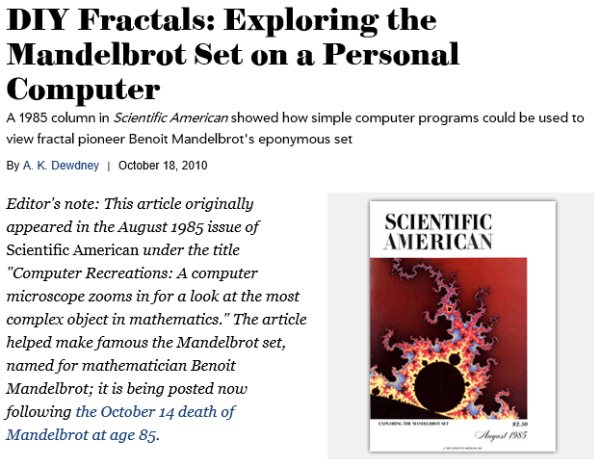
I learned that the original inspiration for Hamster’s project struck him in the mid-1980’s. An article in the Scientific American magazine featured a decidedly more “organic” feel to the fractals than what he had seen prior, and he liked it.
Hamster sought to design something similar and aspired to reach 158,630,400,000 calculations per second. (Wow!)
As to his efforts on with the Mandlebrot set and his Nexys Video board, Hamster humbly writes, “Sadly my design falls just short of the 158,630,400,000 calculations needed per second, but maybe someday I will get there!” I have no doubt he will.
Breaking it down into numbers was a real eye-opener for me. We’re talking about billions of calculations per second. Yes, billions! Below is what he shared with me in regards to understanding the vast scope of the numbers and calculations involved.
1. If the full image was the size of the continental USA, The level of magnification is equivalent to zooming down to the pixels on a HD 4″ cell phone display.
2. The sheer magnitude of the calculations taking place is mind-boggling (just short of the 158,630,400,000 calculations per second).
3. Each of these calculations requires 10 basic operations (3 multiplies, and other 7 basic operations (e.g. addition)), and usually people stop when the calculation has been repeated 255 times per pixel (as 255 is the maximum value that can be held in a single byte).
4. Assuming that we are stopping at 255, it takes 2550 operations to calculate the color to display for each pixel on the screen, for a total of 5,287,680,000 operations for all the pixels of a 1920×1080 image.
5. For smooth scrolling and zooming, every pixel has to be recalculated for every frame, and, when using 1080i video, there are 30 frames every second.
Crazy cool project, Hamster!
Hamster is an active member on our forum and a valued part of our open source community. He shares his knowledge by answering questions and posting his projects to our forum. I encourage you to take some time to visit our forum and check out some of his other work.
Do you have something to share? We invite you to join our community and share projects that you have created. Maybe someday you will see your project featured on our blog! If you liked this post and have anything to add, feel free to leave a comment here.