

Averaging several single-point measurements you place with oscilloscope cursors is a practical way to get a stable “representative” value of a signal at specific times or levels. WaveForms doesn’t (currently) provide a one‑click “average of multiple cursor voltages” measurement, but you can achieve the same outcome reliably using the built‑in Measurements tool.
The Context: “Average of Multiple Cursors’ Readings”
A recent Digilent forum question asked whether it’s possible to compute “the average of the four voltage values” associated with multiple cursors in WaveForms (see thread: Average of multiple cursors’ readings). That use case is common across a few applications: you place cursors at several meaningful points (e.g., plateau regions, pulse tops, or sample instants) and want a single number summarizing them. Read the forum thread here: https://forum.digilent.com/topic/33314-average-of-multiple-cursors-readings/
What does WaveForms do directly?
The app offers cursors, measurements, statistics, math channels, and in‑app scripting, but its out‑of‑the‑box measurements don’t include “average of multiple cursor readings.”
A different forum thread clarified a related point: by default, WaveForms measurements are computed over the visible portion of the waveform (zoomed view), and while statistics (mean/median, etc.) can be computed over an “extent” between two cursors, there isn’t a built‑in toggle to compute “average of the levels only at a set of cursors” directly. [forum.digilent.com]
Why is Averaging Cursor Readings Useful?
A couple reasons:
When you repeatedly sample a value at a specific time (or at several times) on a noisy signal, the individual readings vary. Averaging dampens random fluctuations and yields a more stable estimate of the underlying value—exactly the same rationale used by “waveform averaging” features in oscilloscopes to improve SNR.
If a plateau isn’t perfectly flat, or a system exhibits cycle‑to‑cycle variation, taking multiple cursor readings across a region and averaging them helps report the typical level without being biased by a single measurement.
Mainly, it’s a quick add-on to how an engineer already typically interacts with a scope. To build intuition and get some quick estimates, engineers might visually place cursors where it “matters” (edges, mid‑level crossings, steady‑state segments). Averaging those hand‑picked points bridges qualitative visual inspection and quantitative reporting by letting engineers inform the tools what the most relevant sections are. And hand-selection is often much faster than coding some bespoke solution for a single measurement when you’re already falling down a debugging rabbit-hole.
Try it Yourself:
- Zoom/pan the oscilloscope view so that the intended region is visible.
- Place cursors at the points of interest by clicking the “X” button in the bottom left. Set each cursor to not reference another cursor, “Reference: none”.
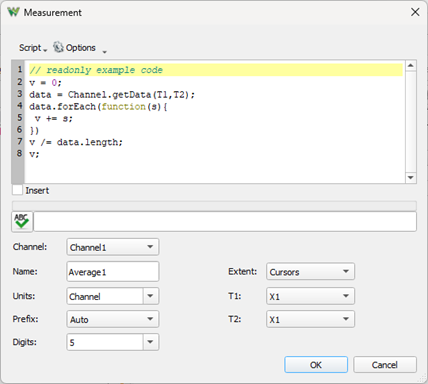
- Enable Measurements and create new custom measurements for each cursor.
Give the measurement a unique name, so it can be referenced elsewhere.
Set the “Extent” to “Cursors” and “T1” and “T2” to the same cursor.
This screenshot shows a measurement that was initially created as the average of channel 1, and then customized.
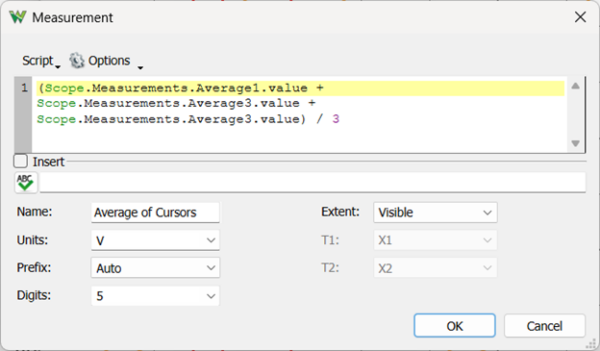
4. Create a custom Global measurement and hand-compute the average of each of the measurements based on cursor position.
5. Use Show and the Gear dropdown in the Measurements tab to turn on statistics like mean/median measurements across multiple acquisitions (if you need temporal robustness or repeated trials).
Note: You might need to move your cursors or start/stop the acquisition to start picking up the new measurements.
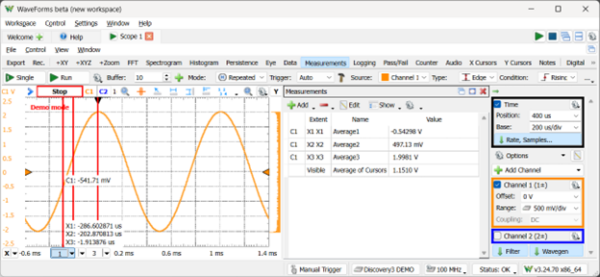
Refer to the first image in this post for a sample of what you should see.
For some other features you may have noticed along the way, “Extent”’s use with cursors is a deeply powerful concept in WaveForms. Pre-defined measurements include many time and voltage-based computations, including minimums, maximums, overshoot on an edge, even estimated frequency and duty cycles. With “Extent”, any measurement can span any pair of cursors you wish.
Combining these things means that you can really narrow in on the interesting part of a signal. If you have some confounding noise or a glitch on the back edge of a pulse, but you still need to measure overshoot to solve a more important problem, you can bracket the rising edge you’re triggering off of with cursors and still make the measurement. You can even go back and add some more cursors to make the other measurement (maybe a glitch pulse height in this case) at the same time.
Furthermore, “Visible” extent implies that you can perform measurements on signals outside of the normal view of the oscilloscope plot. “Capture” extent lets you narrow in on signals that aren’t even currently visible, as long as they fell within the capture window based on trigger settings.
Take it Further with WaveForms and Digilent Instruments
The cursor‑based averaging workflow shown above is just one example of how WaveForms lets you adapt measurements to the way you analyze real signals. Beyond cursors and custom measurements, WaveForms provides built‑in statistics, math channels, scripting, and flexible measurement Extents, all designed to help you isolate meaningful behavior in noisy or complex waveforms.
These capabilities are available at no additional cost with Digilent’s USB oscilloscopes and mixed‑signal instruments, making them well suited for everything from quick bench checks to deeper signal exploration:
If you run into a measurement challenge that doesn’t fit neatly into an out‑of‑the‑box feature—or you discover your own creative workflow—the Digilent Forum is where many of these ideas originate. Ask questions, browse past discussions, or share your solution to help others working through similar problems: