DIY ECG With Analog Discovery Studio and LabVIEW
 Note: This is NOT a medical device. Should be used for educational purposes only.
Overview
This demo uses the Analog Discovery Studio's Oscilloscope to measure the natural electrical potential generated by the heart. As the measured signal is of very low amplitude, it first needs to be amplified with external circuitry, which can be built on the Breadboard Canvas and supplied from the Analog Discovery Studio Power Supplies. With the help of WaveForms VIs, the received data is sent to LabVIEW, where the postprocessing is done.
Inventory
Software
- A computer with the latest version of WaveForms and LabVIEW Community installed
- WaveForms VIs (check this guide: Getting Started with LabVIEW and a Digilent Test and Measurement Device)
Hardware
- Analog Discovery Studio with Breadboard Canvas and MTE cables
- Analog parts and wires (all found in the Analog Parts Kit)
- 2 x 1N914 diode
- 1 x 47 nF capacitor (473)
- 4 x 4.7 KΩ resistor (yellow-purple-red-gold)
- 1 x 10 KΩ resistor (brown-black-orange-gold)
- 2 x 20 KΩ resistor (red-black-orange-gold)
- 3 x 100 KΩ resistor (brown-black-yellow-gold)
- 1 x 150 KΩ resistor (brown-green-yellow-gold)
- 2 x 470 KΩ resistor (yellow-purple-yellow-gold)
- Jumper wires
- 3 x Alligator clips
- 3 x Surface electrodes
Note: The ECG design can still be viewed and run in software without all of the hardware, through the use of an imported data file. See Testing Without External Circuitry, in the Testing section, below.
Setup and Use Instructions
Circuit Setup
This section will go through each stage of the ECG circuit. There is a diagram of the completed circuit, as well as a wiring diagram made in Fritzing, at the last step, if you wish to skip to that step.
Building the Amplifier Circuit
The amplitude of the potential difference on the skin is just in the millivolt or microvolt range, so it has to be amplified. To amplify the signal an instrumentation amplifier is built using OP482. The gain is set to 500 (A = (1 + 2 * R2/R1) * R3/R4). The + input should be connected to the right leg, above the ankle, the - input to the right hand, on the wrist. Between the surface electrodes and the inputs of the instrumentation amplifier 100 kΩ resistors are connected to limit any current circulating towards the body (in case of faulty operation).

The output of the amplifier can be visualized with the help of the Oscilloscope instrument in WaveForms.

Filtering Out the Common Mode Signal
It can be seen, that the measured signal is too noisy, the heart signal can't be recognized. To correct this, the common mode signal from the output of the first amplifier stage is amplified and inverted using the fourth operational amplifier in OP 482 (A = - R6/R5). The amplified and inverted common mode signal (G) is connected to a current limiting resistor, then to the left wrist. Two antiparallel diodes are connected between the G surface electrode and the device's ground to limit the signal between around -0.6 V and +0.6 V, to prevent electrocution.

The signal becomes periodic and less noisy, but it has a large offset.

Eliminating the DC Component
The offset of the signal can be easily eliminated using a small decoupling capacitor between the output of the instrumentation amplifier and the oscilloscope probe.

On the power spectrum of the signal the DC component disappears. As the 50 Hz sine signal from the mains can be found on the skin, high power spectral components appear at multiples of 50 Hz. However, these can be eliminated easier using high order digital filters in LabVIEW, than with analog filters.

Wiring diagram in Fritzing
In the picture to the right, the wiring diagram of the same circuit is presented, but built in Fritzing, in case that is easier to follow.

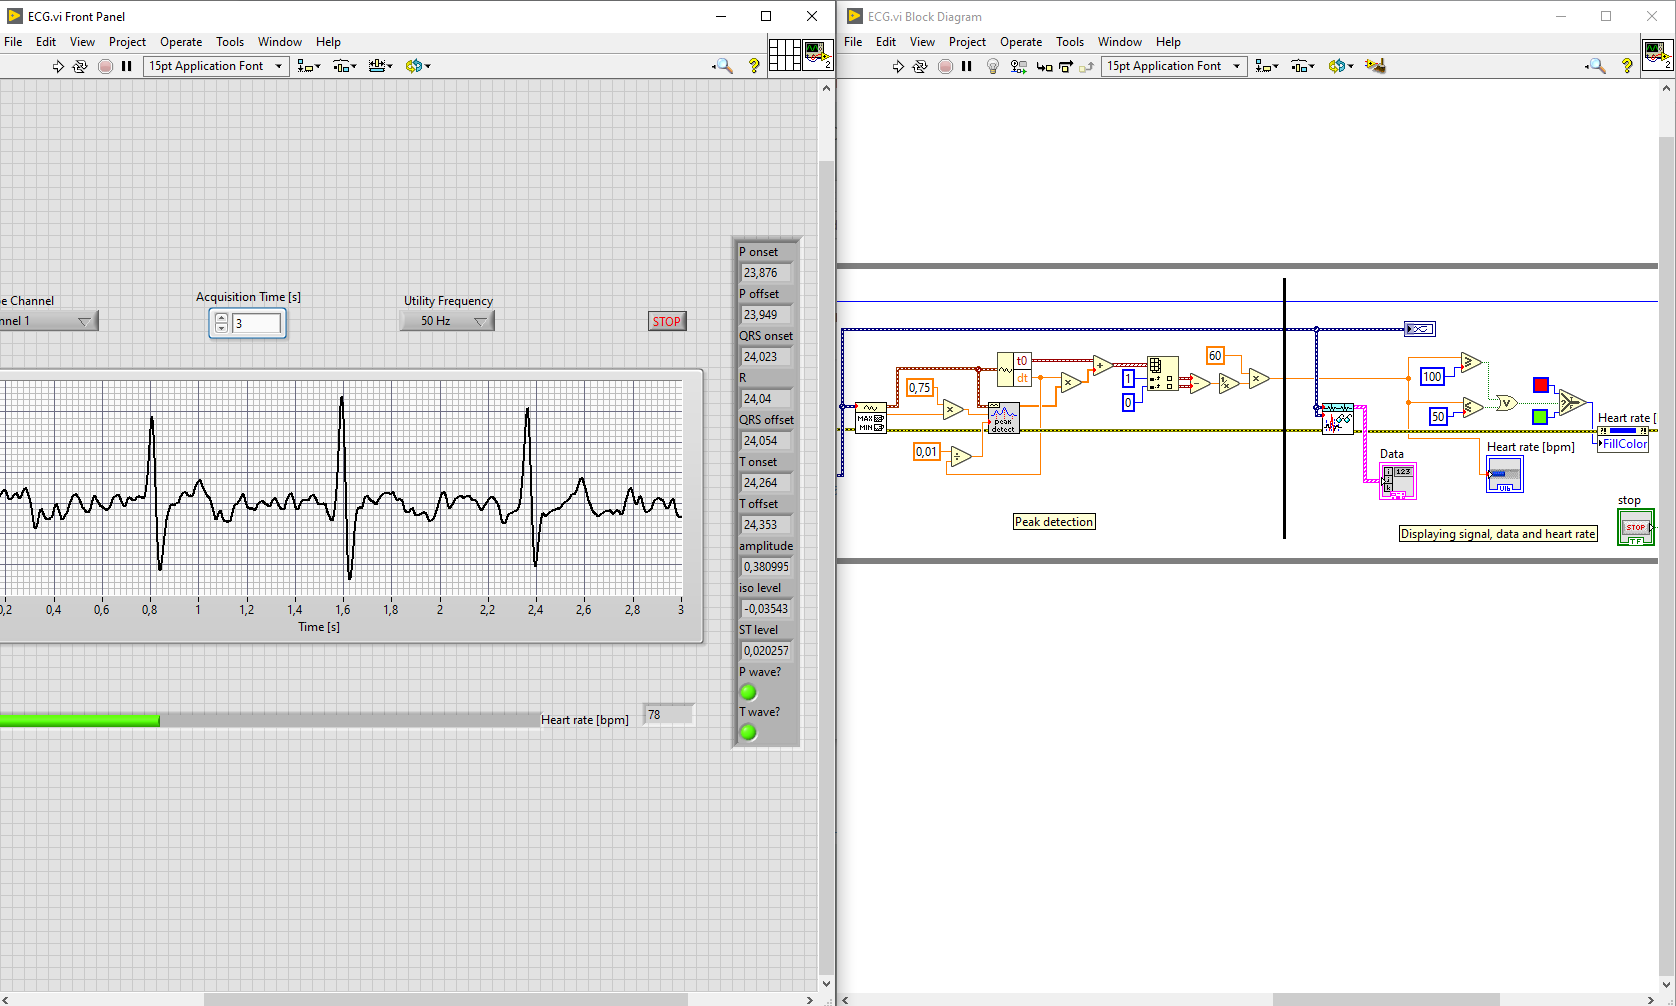
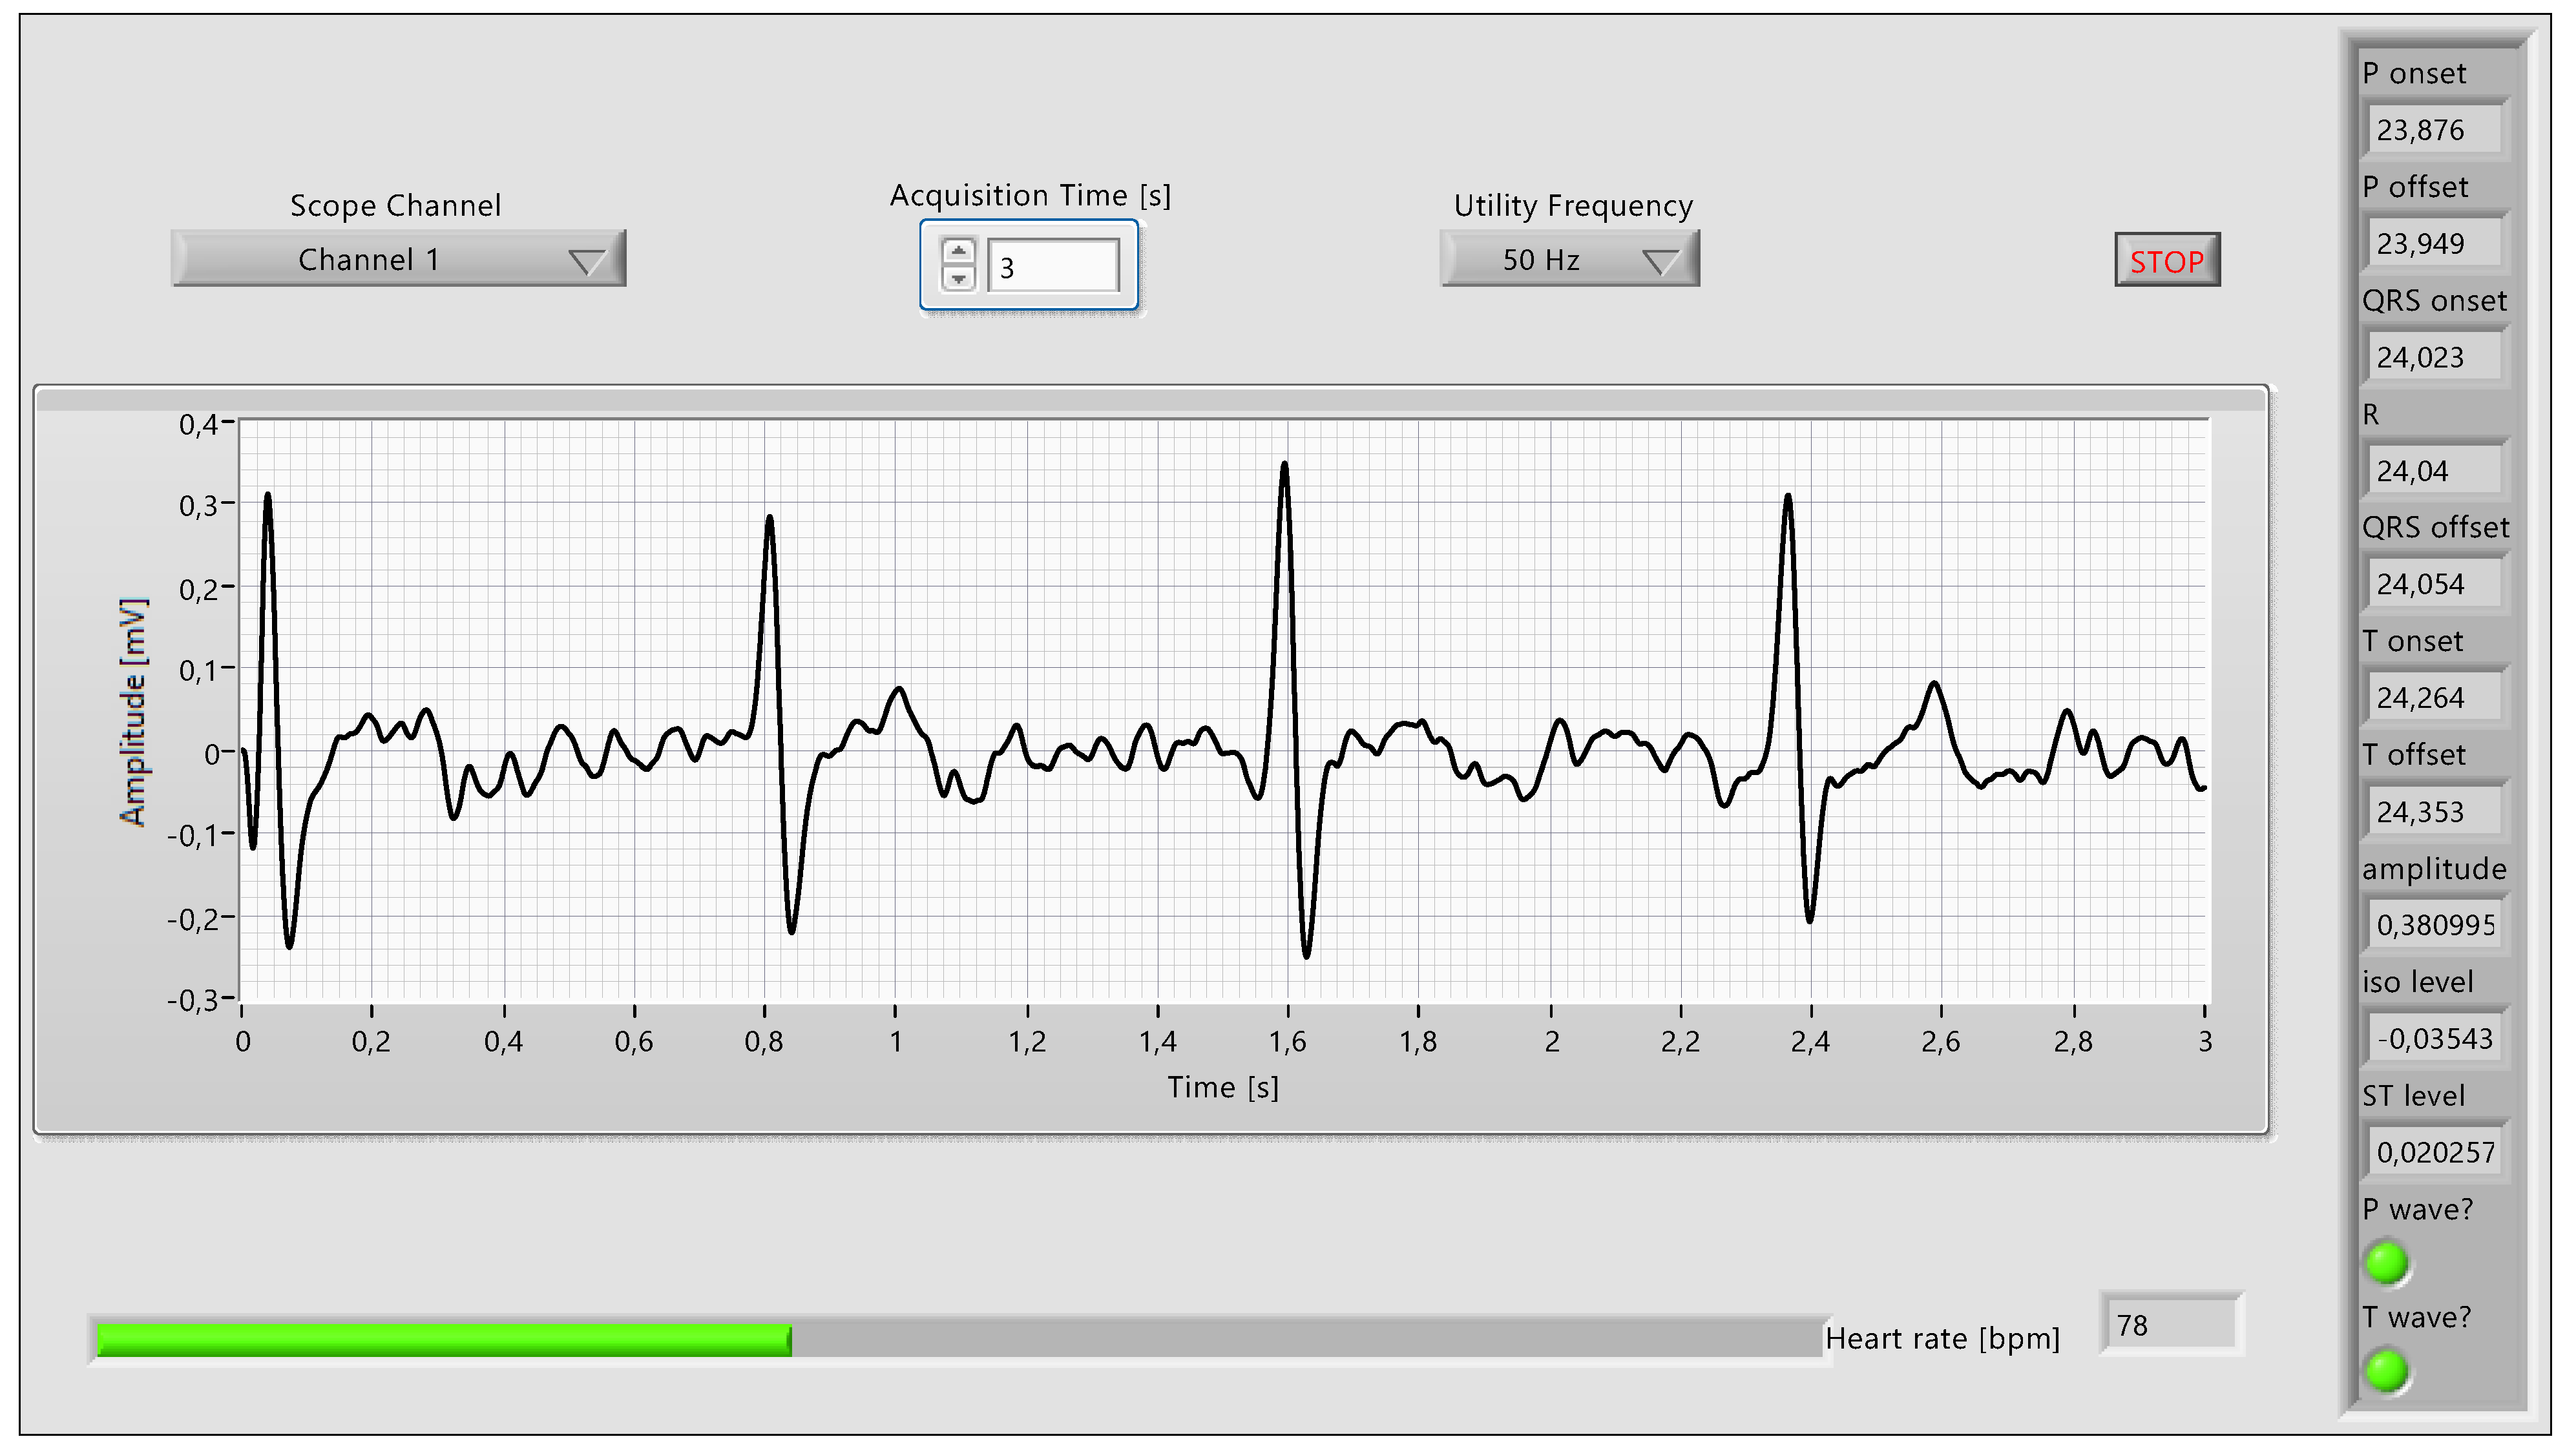
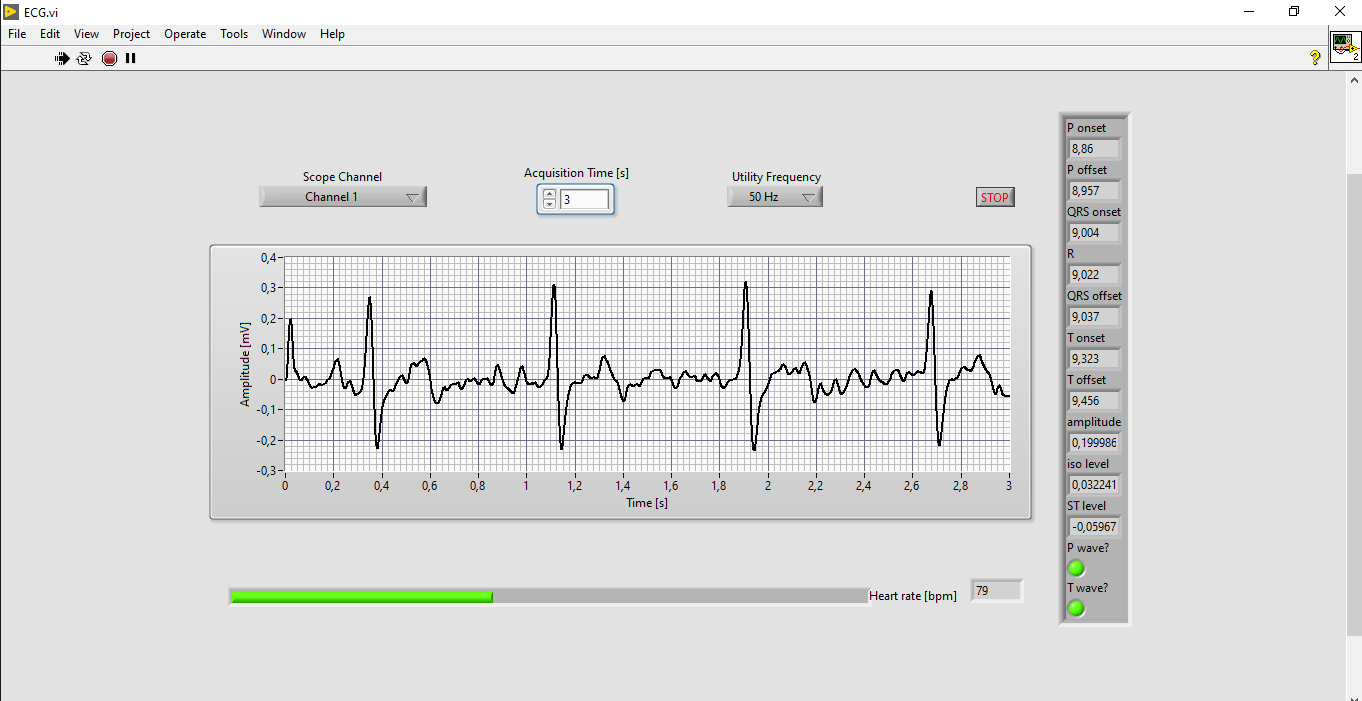
User Interface
Download, unzip and open the ECG VI attached at Inventory. On the front panel, to control the data acquisition and the post-processing, four elements are available: a drop-down list for selecting the Oscilloscope channel, an input field for entering the number of seconds for which data is acquired, a drop-down list for selecting the mains frequency, which will be filtered out later, and a Stop button, which stops the measurement (after pressing the button, the current acquisition is finished, then the program is stopped).
Below the control elements, a plot pane is placed, where the electrocardiograph signal is displayed. Below the plot pane, a slider and a numeric indicator shows the calculated heart rate, the slider being green when the heart rate is considered normal (between 50 and 100 bpm) and red otherwise. On the right part, a column is placed, where all the data acquired from the ECG feature extractor block is displayed (see: ECG Feature Extractor VI).
Data Flow
Data Aquisition
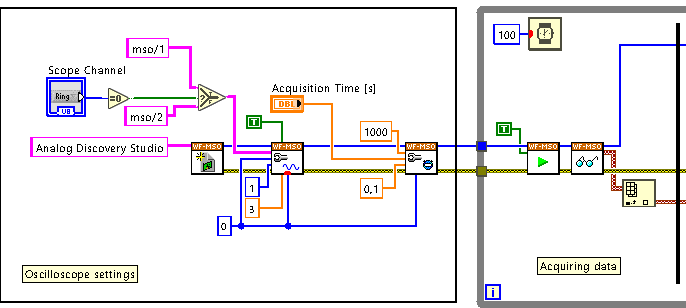
The block diagram of the ECG VI is divided at six parts with different decorational elements and structures. The first two parts are responsible for initializing the Oscilloscope instrument and receiving data from it. In the first part the used Test and Measurement device is set to be the Analog Discovery Studio, the scope channel is selected with the help of the respective control element on the front panel, the probe attenuation is set to 1 (because MTE cables are used), the vertical coupling is set to AC, the offset to 0 and the range from -1.5V to +1.5V (this doesn't matter as autoscale can be turned on on the plot pane).
Acquisition mode of the scope is set to sampling with a 1000 sample rate for the time specified with the help of the control element on the front panel. After the initialization, the instrument handle and the error signal are sent in a while loop, where data acquisition starts and continues until the Stop button is pressed.
Postprocessing
The acquired signal is still as noisy as seen on the Oscilloscope in WaveForms, so it needs filtering. After the DC component is estimated and subtracted from the signal to remove any offset (some might remain after the decoupling), the data enters a moving average filter, its parameters depending on the utility frequency. This filter eliminates almost completely the 50 Hz or 60 Hz component in the power spectrum, as well as its harmonics. The exiting signal is smoothed. As it can be seen on the power spectrum at Circuit Setup, the most significant components of the signal are below 50 Hz, so filtering out everything above that should not damage the useful signal. However, as the QRS wave (the high amplitude part of the ECG signal) has a rise time of around 15 ms, a 25 Hz threshold should be considered, the cutoff frequency of the low-pass filter becoming 75 Hz.
After proper filtering, the maximum point of the data set is acquired and, with a peak detector, all the data points above 75% of this maximum and 10 ms wide are found (the P - preceding QRS - and T - proceeding QRS - signals of the should not reach that amplitude). The location of these points are multiplied with the time derivative of the signal and summed with the starting time to get the exact time of each peak. Time between two consecutive peaks is calculated and converted to frequency, then multiplied with 60 to get the number of beats (peaks) per minute.

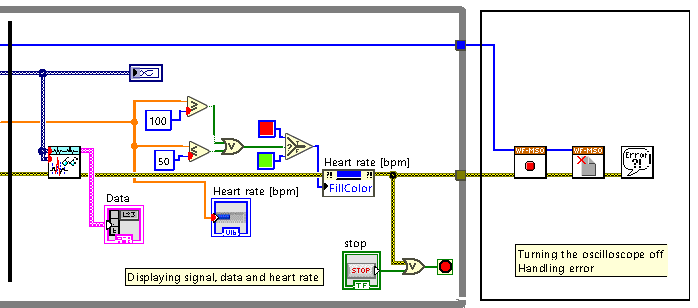
Results and Cleanup
The filtered signal is connected to the plot pane and to the ECG feature extractor to visualize the signal itself as well as the data about it. The calculated heart rate is also visualized with the help of the slider, but also evaluated and if it is lower than 50 bpm, or higher than 100 bpm, the fill color of the slider is changed to red (otherwise it is green).
The while loop is exited only if the stop button is pressed or if there is an error, but in both cases the current data acquisition is finished first. After exiting the loop, the Oscilloscope instrument is stopped and closed to make the Analog Discovery Studio available for other programs. The errors are also handled here: if there was any error, the respective message is displayed.
Testing
To test the device, build the circuit on the Breadboard Canvas, turn on the Analog Discovery Studio and connect it to a PC. Open the ECG VI. Place one surface electrode on the inner side of your left wrist, one on the inner side of your right wrist and one on the inner side of your right ankle. With the alligator clips, connect the circuit to the electrodes, as shown in the image to the right. Start the VI with the play button. If you stay still for a few seconds, you will see on the plot pane your ECG signal and the estimated heart rate.

- Testing Without External Circuitry
-
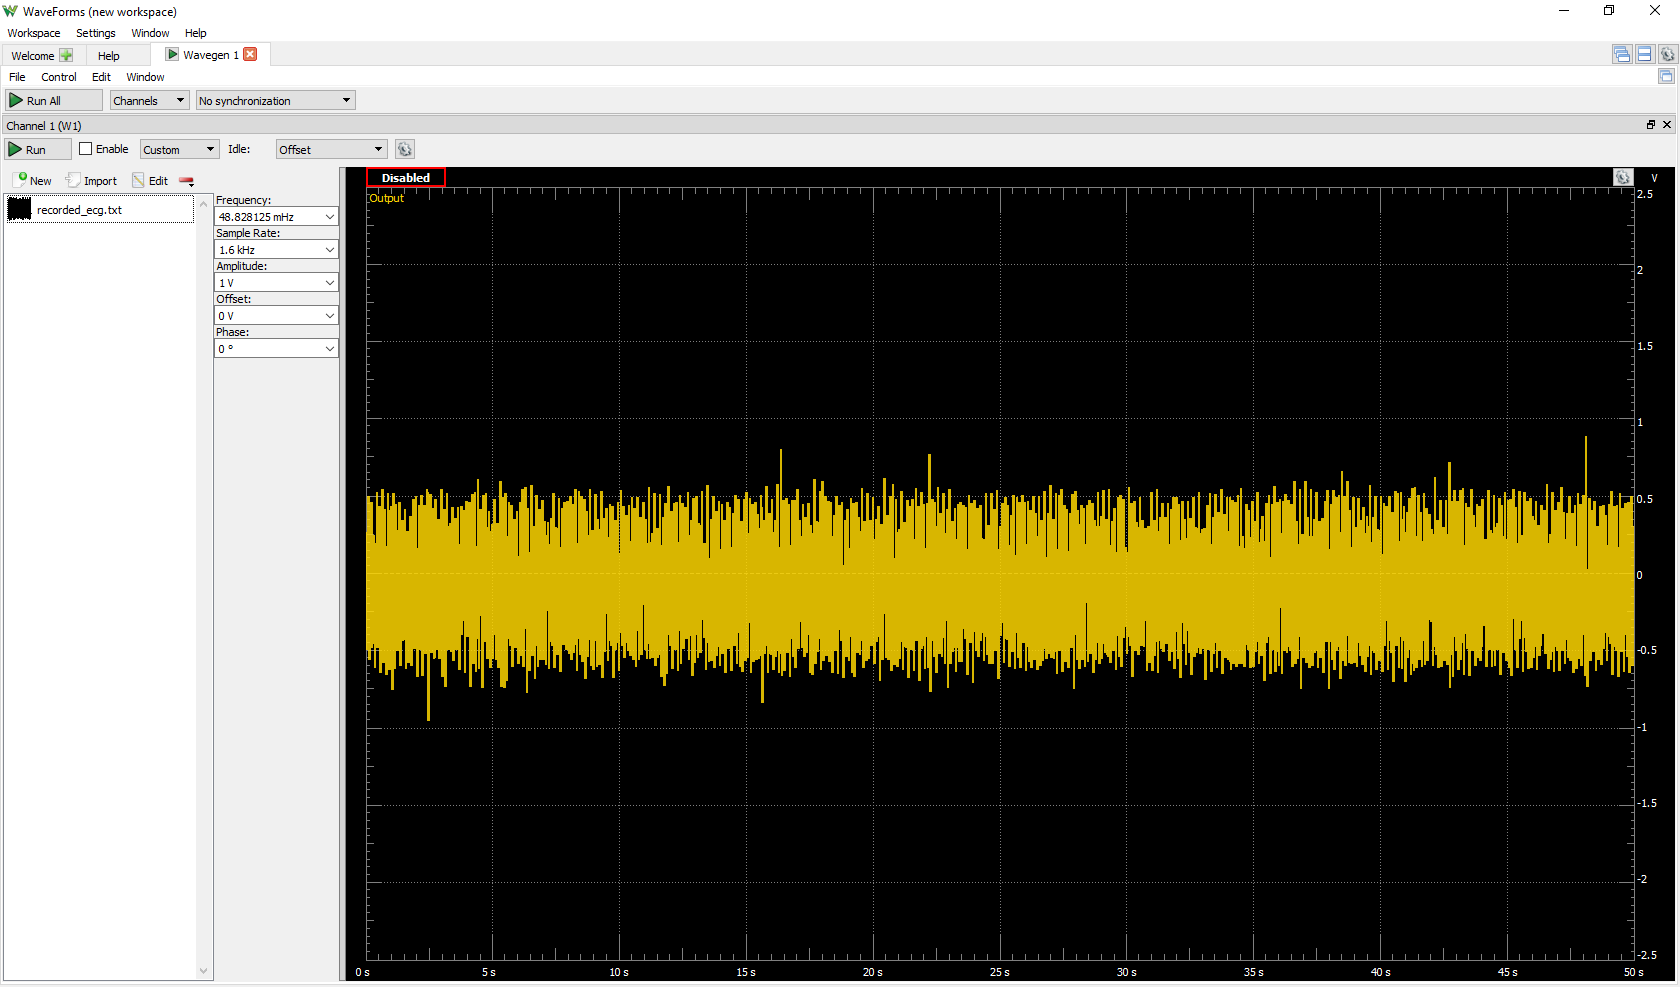
If you don't have the necessary hardware for this project, you can still test the VI, using Analog Discovery Studio and an other Test and Measurement Device (called transmitter in the following). Connect the transmitter's analog output to the Analog Discovery Studio's analog input pins: transmitter yellow wire to ADS orange wire and transmitter black wire to ADS orange-white wire. Open WaveForms connect it to the transmitter device and open the Waveform Generator instrument. Set signal type to Custom, download, unzip and import the following file: Recorded ECG. Leave every setting on default. The file contains several seconds of recorded ECG signal, which can simulate the signal measured with the amplifier circuit. Start the Wavegen and start the ECG VI with the Play button. You can observe the heart signal on the plot pane and the calculated data right to it, as well as the appearing noise at certain times.

References
Final Notes
For more guides and example projects for your Analog Discovery Studio, please visit its Resource Center.
For more information about how to use the software featured in this demo, please visit its respective guide: Getting Started with LabVIEW and a Digilent Test and Measurement Device.
For technical support, please visit the Digilent Forums.