Embedded World 2022 RF Demo with the ADP5250 and USRP B205 Mini-i

Introduction
This demonstration setup will display the abilities of the ADP5250 for use as bench-top RF test equipment for testing the performance of hardware such as the Ettus B205 Mini. A GNU Radio flowgraph and Waveforms workspace is provided for every demonstration RF test for a user to run in real time at the event.
Background
The objective of this demonstration is to showcase the Digilent RF (radio frequency) test equipment at the 2022 Embedded World Exhibition & Conference in Digilent’s booth. This document is detailed such that an end user with or without an RF background can successfully setup the hardware/software and execute the tests, excluding how to install programs such as Waveforms and Gnu Radio. The Gnu Radio flowgraphs and Waveforms workspaces will require no further intervention from the end user past opening the file with the respective software program and clicking ‘Run’ once the hardware has been set up.
Material List
To recreate this demonstration, the following hardware is required (not including the host PC GNU Radio & Waveforms is running on):
- Analog Discovery Pro ADP5250 - Qty. 1
- Analog Discovery Pro ADP5250 BNC Probe Bundle
- P2150 150MHz Oscilloscope Probe - Qty. 2
- BNC to Mini-grabber Cable - Qty. 2
- Set of Red & Black DMM Probes - Qty. 1
- Ettus USRP B205mini-i: 1×1, 70MHz-6GHz SDR/Cognitive Radio - Qty. 1
- Enclosure Kit for Ettus USRP B205mini-i - Qty. 1
- BNC-to-SMA Adapter - Qty. 2
- SMA-to-SMA 24” Coaxial Cable - Qty. 2
- 30dB RF SMA Attenuator - Qty. 1
Host PC Software
The following software is required to be installed on the host PC to run the RF demonstrations outlined in this document:
- Digilent Waveforms - Version 3.1.8
- GNU Radio Companion - Version 3.8.2.0 (Python 3.6.9)
This document will not cover how to install this software as there are many tutorials available for whichever target host PC OS the reader of this document is using. Knitronics has covered how to install GNU Radio on Ubuntu 18.04 specifically for use with the B205Mini: https://www.hackster.io/whitney-knitter/getting-started-with-the-ettus-b205mini-in-gnu-radio- e0d3ea It is recommended to run this demonstration with two separate computers: one running GNU Radio in Ubuntu Linux and the other running Digilent WaveForms on Windows.
- RF Test Demo: Continuous Wave RF Signal Measurements
-
This demonstration encompasses the typical RF test measurements performed on an SDR DUT outputting a CW RF signal (aka - a single, non-modulated sinusoid RF signal) that the ADP5250 is capable of. The RF test measurements performed in this demonstration include:
- RF TX Center Frequency Offset
- RF TX Output Power
- TX Worst Spurious Frequency/Magnitude
- Signal to Noise Ratio
1. Hardware Setup
Connect a 30dB attenuator to the TRX SMA port of the b205mini then connect it to Channel 1 of the ADP5250’s oscilloscope (a male-to-male SMA RF RG316 cable is used with female SMA to female BNC adapter in the photo below). Connect the b205mini to the host PC via its provided USB cable.

2. Software Setup
The following files are required for these demonstrations:
- GNU Radio Flowgraph: b205mini_rf_tester.grc
- WaveForms Workspace: cw_rf_tests.dwf3work
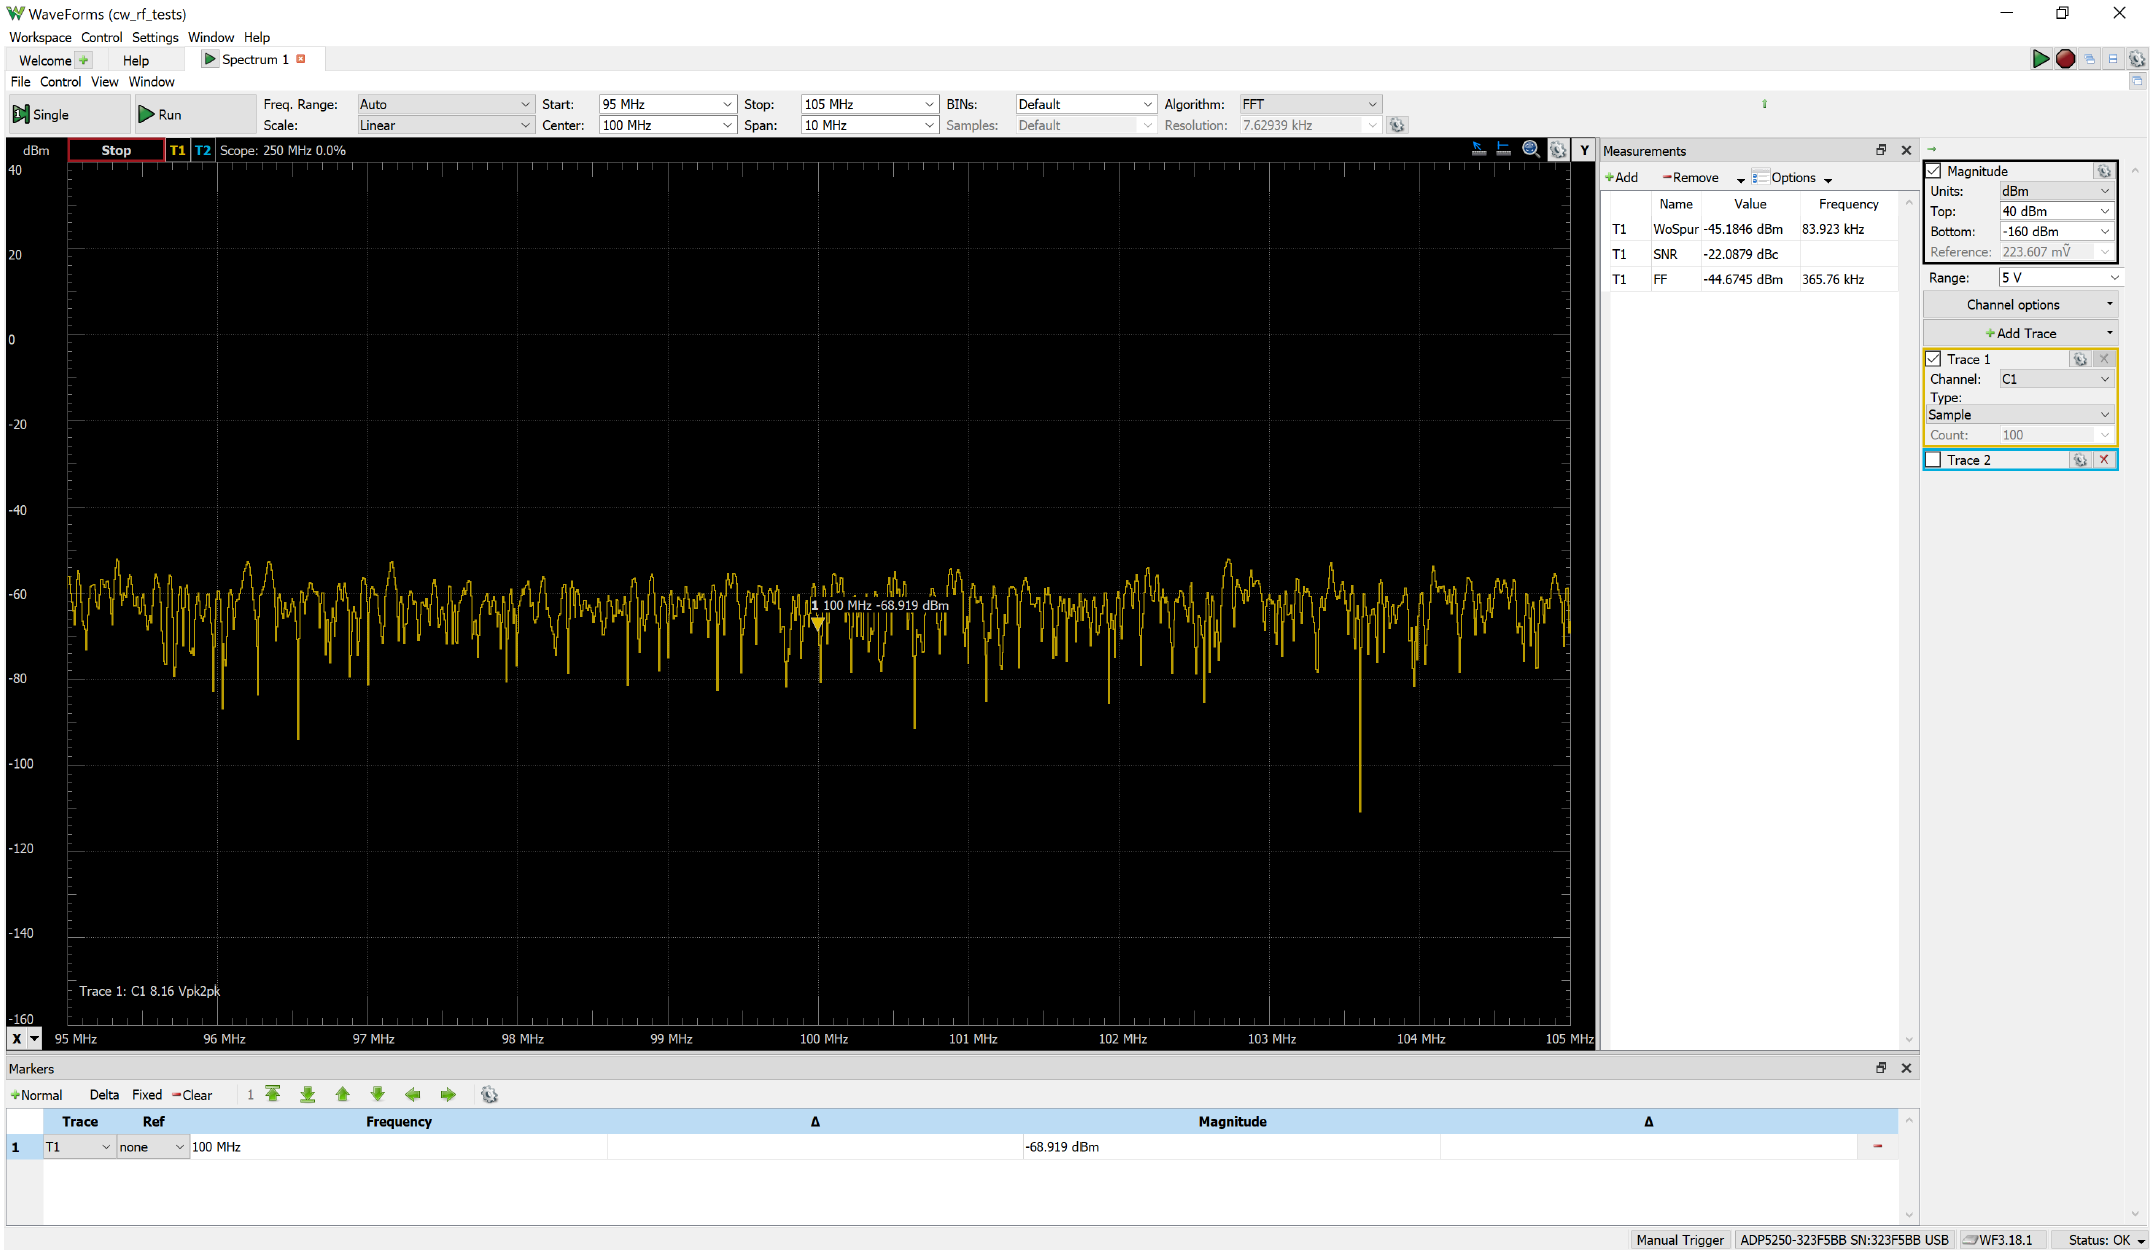
Launch WaveForms and open the cw_rf_tests.dwf3work workspace. It should appear as shown below. Click the Run button to start the ADP5250 measurement capture.
Launch GNU Radio and open the b205mini_rf_tester.grc flowgraph. Click ‘Generate the flowgraph’ button (the icon to the immediate left of the green play button icon) then click ‘Execute the flowgraph’ button (the green play button icon).

3. Execution
In the QT GUI window that appears in Gnu Radio (see screenshot below), all of the default settings are set to match the measurement setup in the Waveforms workspace. If any are changed such as the UHD center frequency, the settings in the Waveforms workspace will need to be adjusted to match.

The UHD gain is the only exception. By default, as a hardware protection effort, the gain is set to zero. This RF signal strength from the B205mini will not be enough to make it through the attenuator and RF cabling for the ADP5250 to distinguish from the noise floor. Use the slider bar to increase the gain until the signal is visible on the spectrum analyzer of the ADP5250. The recommended gain values are 70dB - 90dB(max).
DO NOT leave the transmitter on for indefinite/extended periods of time as there is no cooling mechanisms such as a CPU fan on the b205mini. It is recommended to not let the demo run with the transmitter on for more than 2 minutes at a time with 5 - 10 minutes of a cool down period in-between.
Talking points to note in this demonstration:
- The Measurements functionality in the WaveForms spectrum analyzer are a convenient quick way to take measurements such as SNR, spurious outputs, center frequency offset (fundamental frequency - FF), etc. as they are as simple as selecting them from a menu to view.
- For example: instead of adding a marker and configuring it to look for the highest peak, simply select the fundamental frequency - FF option from the Measurements option found in the View tab.


- RF Test Demo: Narrowband Modulated RF Signal Measurements
-
This demonstration encompasses the typical RF test measurements/analysis performed on an SDR DUT outputting a narrowband FM modulated RF signal that the ADP5250 is capable of. The RF test measurements performed in this demonstration include:
- Signal to Noise Ratio
- Noise Floor
- Aspects of the Measurement/Capture: resolution bandwidth, number of acquisition samples & frequency, number of visible frequency bins of (except DC), effective number of bits of ADC
- Power in Band (using X & Y cursors)
- A list of the top 20 frequency components of the captured signal sorted by respective magnitude
- Persistence window to further visualize how noisy the signal may or may not be
The workspace in WaveForms utilizes the X and Y cursor functions to measure where the 3dB rolloff is on either side of the transmitted signal (which depicts the bounds of the power in the band of modulated signal) on the Y-axis, then the X-axis cursors measure the bandwidth of the frequencies covered. This bandwidth represents the signal bandwidth.
Note: the X & Y cursors may need to be adjusted between runs to account for slight variations in the RF environment.
1. Hardware Setup
Hardware setup is the same as the CW RF Signal Measurement demonstration as outlined previously in this document. Refer to it if hardware is not already set up.
2. Software Setup
The following files are required for these demonstrations:
- GNU Radio Flowgraph: b205mini_nbfm_pwr_in_band.grc
- WaveForms Workspace: nb_mod_rf_tests.dwf3work
Launch WaveForms and open the nb_mod_rf_tests.dwf3work workspace. It should appear as shown below. Click the Run button to start the ADP5250 measurement capture.

Launch GNU Radio and open the b205mini_nbfm_pwr_in_band.grc flowgraph. Click ‘Generate the flowgraph’ button (the icon to the immediate left of the green play button icon) then click ‘Execute the flowgraph’ button (the green play button icon).

3. Execution
In the QT GUI window that appears in Gnu Radio (see screenshot below), all of the default settings are set to match the measurement setup in the Waveforms workspace. If any are changed such as the UHD center frequency, the settings in the Waveforms workspace will need to be adjusted to match.

The UHD gain is the only exception. By default, as a hardware protection effort, the gain is set to zero. This RF signal strength from the b205mini will not be enough to make it through the attenuator and RF cabling for the ADP5250 to distinguish from the noise floor. Use the slider bar to increase the gain until the signal is visible on the spectrum analyzer of the ADP5250. The recommended gain values are 70dB - 90dB(max).
DO NOT leave the transmitter on for indefinite/extended periods of time as there is no cooling mechanisms such as a CPU fan on the b205mini. It is recommended to not let the demo run with the transmitter on for more than 2 minutes at a time with 5 - 10 minutes of a cool down period in-between.
Talking points to note in this demonstration:
- Again, the Measurements functionality in the WaveForms spectrum analyzer are a convenient quick way to take measurements.
- Using the X & Y cursors to measure the power in band and the persistence view to help evaluate how noisy the signal may be are value initial design prove-in tools. Particularly in the narrowband space.

Note: the UHD gain is set to 75.0 for the measurement results show above.


- RF Test Demo: Wideband Modulated RF Signal Measurements
-
This demonstration encompasses the typical RF test measurements/analysis performed on an SDR DUT outputting a wideband FM modulated RF signal that the ADP5250 is capable of. The RF test measurements performed in this demonstration include:
- Noise Floor
- Aspects of the Measurement/Capture: resolution bandwidth, number of acquisition samples& frequency, number of visible frequency bins of (except DC), effective number of bits of ADC
- Power in Band (using X & Y cursors)
- A list of the top 20 frequency components of the captured signal sorted by respective magnitude
- Persistence window to further visualize how noisy the signal may or may not be
The workspace in WaveForms utilizes the X and Y cursor functions to measure where the 3dB rolloff is on either side of the transmitted signal (which depicts the bounds of the power in the band of modulated signal) on the Y-axis, then the X-axis cursors measure the bandwidth of the frequencies covered. This bandwidth represents the signal bandwidth.
Note: the X & Y cursors may need to be adjusted between runs to account for slight variations in the RF environment.
1. Hardware Setup
Hardware setup is the same as the CW RF Signal Measurement demonstration as outlined previously in this document. Refer to it if hardware is not already set up.
2. Software Setup
The following files are required for these demonstrations:
- GNU Radio Flowgraph: b205mini_wbfm_pwr_in_band.grc
- WaveForms Workspace: wb_mod_rf_tests.dwf3work
Launch WaveForms and open the wb_mod_rf_tests.dwf3work workspace. It should appear as shown below. Click the Run button to start the ADP5250 measurement capture.

Launch GNU Radio and open the b205mini_wbfm_pwr_in_band.grc flowgraph. Click ‘Generate the flowgraph’ button (the icon to the immediate left of the green play button icon) then click ‘Execute the flowgraph’ button (the green play button icon).

3. Execution
In the QT GUI window that appears in Gnu Radio (see screenshot below), all of the default settings are set to match the measurement setup in the Waveforms workspace. If any are changed such as the UHD center frequency, the settings in the Waveforms workspace will need to be adjusted to match.

The UHD gain is the only exception. By default, as a hardware protection effort, the gain is set to zero. This RF signal strength from the b205mini will not be enough to make it through the attenuator and RF cabling for the ADP5250 to distinguish from the noise floor. Use the slider bar to increase the gain until the signal is visible on the spectrum analyzer of the ADP5250. The recommended gain values are 70dB - 90dB(max).
DO NOT leave the transmitter on for indefinite/extended periods of time as there is no cooling mechanisms such as a CPU fan on the b205mini. It is recommended to not let the demo run with the transmitter on for more than 2 minutes at a time with 5 - 10 minutes of a cool down period in-between.
Talking points to note in this demonstration:
- Again, the Measurements functionality in the WaveForms spectrum analyzer are a convenient quick way to take measurements.
- Using the X & Y cursors to measure the power in band and the persistence view to help evaluate how noisy the signal may be are value initial design prove-in tools.

Note: the UHD gain is set to 77.0 for the measurement results show above.


References Needed for the Project
Acronyms Used in this Article
- ADP - Analog Discovery Pro
- BNC - Bayonet Neill–Concelman connector
- CW - Continuous Wave
- DUT - Device Under Test
- FM - Frequency Modulation
- SDR - Software Defined Radio
- OS - Operating System
- PC - Personal Computer
- RF - Radio Frequency
- SMA - SubMiniature version A connector
- SNR - Signal-to-Noise Ratio
- USRP - Universal Software Radio Peripheral