Analog Discovery - Ohm's Law and Voltage-current Characteristics
Project 2: Resistors
In this project, we will apply a time-varying volatge to a resistor using the Analog Discovery waveform generator. We will use the Analog Discovery oscilloscope to measure the resulting current and plot the voltage as a function of current. The resulting plot will show the resistor's voltage-current characteristic, or I-V curve.
Ohm's law provides the relationship between the voltage across a resistor and the current through it. Mathematically, Ohm's law is stated as:
$v = i \cdot R$
Where v is the voltage across the resistor, i is the resistor current, and R is the resistance.
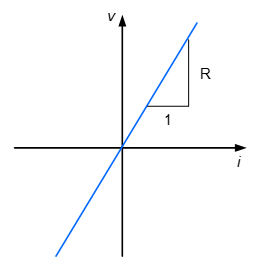
Ohm's law can also be viewed as a voltage-current characteristic for the resistor. The voltage-current characteristic of a component is simply the relationship between voltage and current at the component's terminals. Often, the voltage-current characteristic is presented graphically; in graphical form, the voltage-current characteristic is called the i-v curve. The i-v curve for a resistor is displayed in Fig. 1. As Ohm's law would indicate, the i-v curve is a straight line with slope R. (Assuming that voltage is plotted on the vertical axis and current on the horizontal axis. If the axes are switched, the slope is $\frac{1}{R}$. Either approach is legitimate.)
Related Material:
Prerequisites
- Be able to use the Analog Discovery Waveform Generator to provide time-varying voltages.
- Be able to measure voltage.
- Be able to measure current.
- Be able to state Ohm's law from memory.
Inventory
- 1 100Ω resistor (brown, black, brown)
- 1 Arbitrary resistor with red as the third color band (we will deem this arbitrary resistor as “unknown”)
1. Understanding the Circuit
A. Circuit Schematic
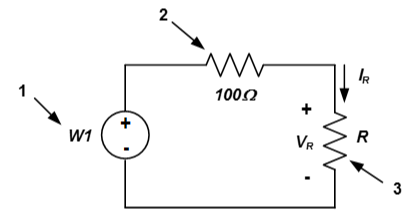
- Use W1 to apply voltage across the resistor.
- The 100Ω will be used to determine the current, IR.
- The arbitrary resistor whose i-v characteristic is to be determined.
- We will measure the voltage across the unknown resistor, VR, and the current through the resistor, IR.
B. Create Circuit
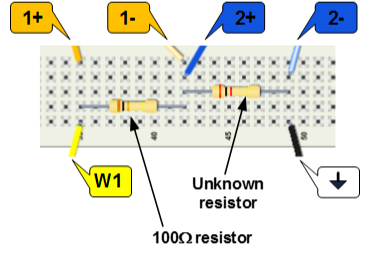
- Connect W1 (the yellow wire) to the 100Ω resistor.
- Connect the two resistors together.
- Connect ground (↓, the black wire) to the unknown resistor.
- Use channel 1 of the oscilloscope (1+ and 1-, the orange wire and the orange wire with the white stripe) to measure the voltage across the 100Ω resistor.
- Use channel 2 of the oscilloscope (2+ and 2-, the blue wire and the blue wire with the white stripe) to measure the voltage across the unknown resistor.
2. Set up Instruments
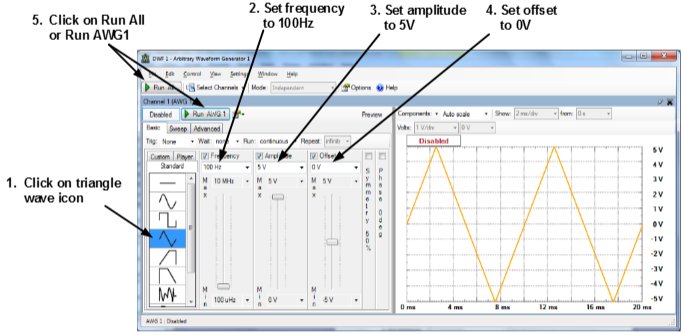
A. Setup the waveform generator to create a 100Hz triangular wave.
B. Display I-V curve using the oscilloscope and estimate resistance
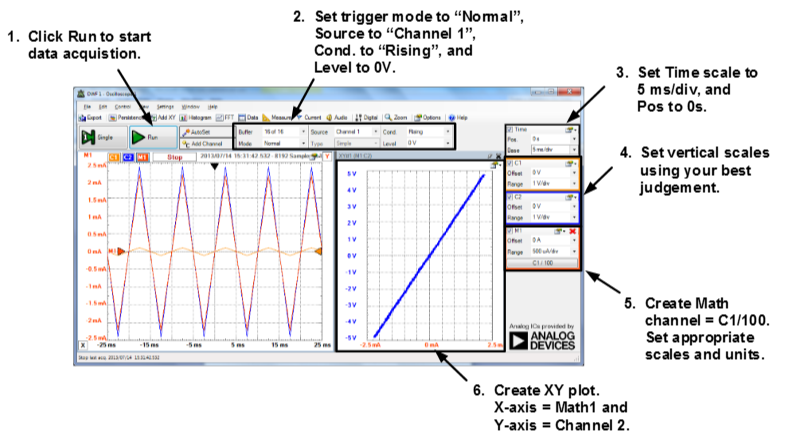
The figure below is intended as a summary of the basic steps to create the resistor I-V curve. Your scope settings will likely be different than those shown, since your unknown resistor will likely differ from the one used to generate this figure.
7. Estimate the slope of the XY plot. This should be the same as the resistance of your unknown resistor.
8. Using the color code on the unknown resistance, determine the nominal resistance of the resistor. Compare this value with the estimated resistance determined in step 7 above.
9. Use your DMM to measure the resistance.
Test Your Knowledge
- Change the axes on the XY plot so that current is on the vertical axis and voltage is on the horizontal axis. Verify that the slope of the new line is the inverse of the resistance of the unknown resistor.
- Change the frequency of the input signal. Verify that changing the frequency has no effect on the resistance value.
- Change the amplitude of the input signal. Does this have any effect on the XY plot and estimated resistance?
- Change the input waveform to a sinusoid. What is the effect on the XY plot and the estimated resistance?
- Change the input waveform to a square wave. Does this have the effect on the XY plot that you would expect? (Hint: an ideal square wave provides only two voltage values—a high voltage and a low voltage.)

